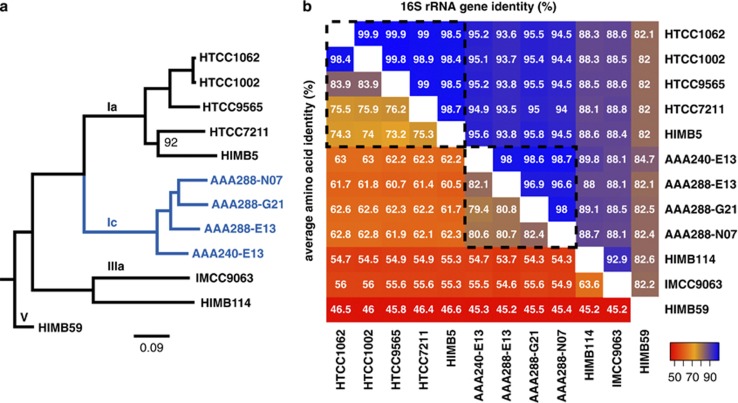
Figure 5.
(a) Maximum likelihood tree of the SAR11 clade using 322 concatenated proteins. Subclade Ic highlighted in blue. All nodes had 100% bootstrap support unless otherwise indicated. Scale bar indicates changes per position. Root was inferred from Thrash et al. (2011) and Figure 1. (b) Average amino-acid identity vs 16S rRNA gene identity. Colors correspond to values in each cell according to the key. Dashed line indicates genus-level boundaries according to Konstantinidis and Tiedje (2007). Note, AAA240-E13 has only a partial 16S rRNA gene sequence, all others are full-length (see Supplementary Information).

