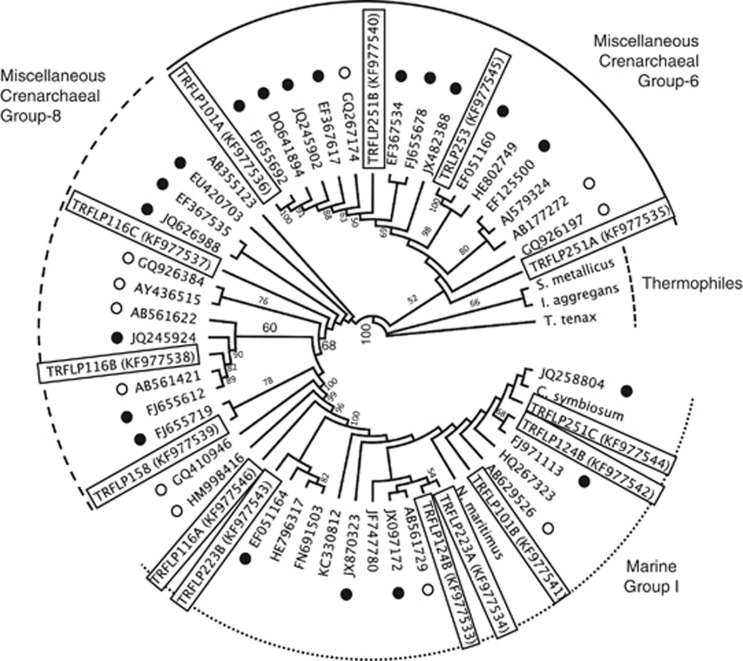
Figure 4.
Phylogenetic estimation using Maximum Likelihood (PhyML) tree with support from 100 bootstrap runs indicated. The clones in this study are indicated with TRF size and GenBank accession numbers. Black dots represent sequences found in coastal or estuarine sediments. Open dots signify sequences from the marine deep biosphere.

