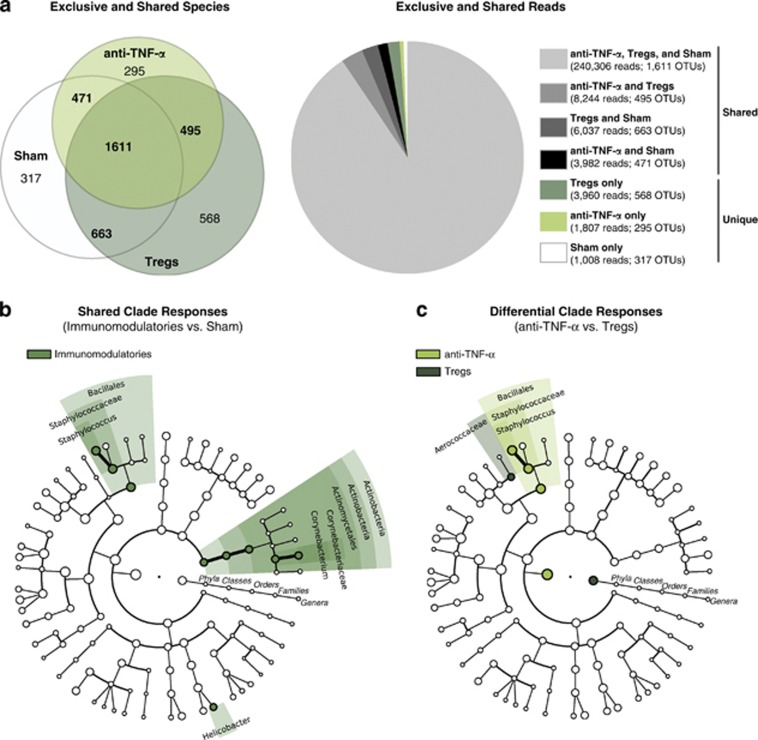
Figure 3.
Immunomodulatories influence low abundance gut microbial community members and drive distinct microbial responses. (a) Left panel: Venn diagram of exclusive and shared species-level phylotypes (non-singleton OTUs, at ⩾97% sequence identity) in anti-TNF-α injected (n=10), TReg infused (n=10) or sham (untreated; n=12) mice. In total, 4420 OTUs were present across samples. Right panel: number of 16S rRNA gene sequences in each of the indicated segments of the Venn diagram. In total, 265 344 sequences were present across samples. (b) Differentially abundant microbial clades in stool from immunomodulatory-treated (anti-TNF-α or TRegs; n=20) versus sham (n=12) mice. (c) Differentially abundant microbial clades in stool from anti-TNF-α-(n=10) versus TReg (n=10)-treated mice. For cladograms, white circles represent non-significant microbial clades.

