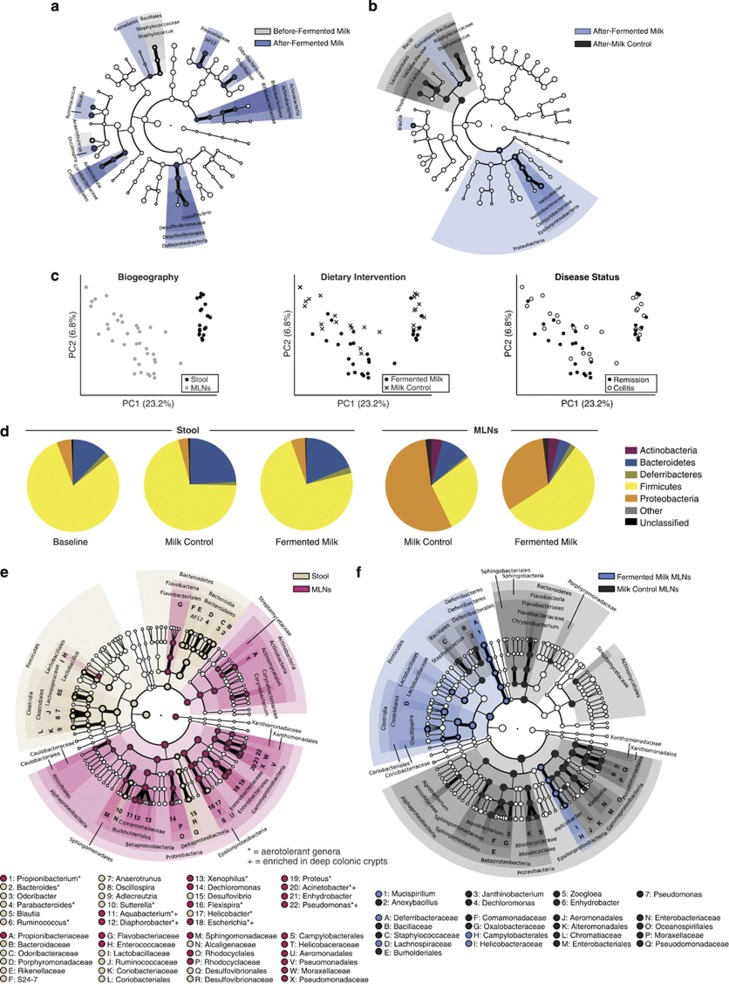
Figure 4.
A FMP influences the microbial communities of the gut and MLNs. (a) Differentially abundant microbial clades in stool collected before and after FMP (n=10). (b) Differentially abundant microbial clades in stool after FMP (n=10) versus MC (n=10). (c) PCoA plots of the unweighted UniFrac distances of post-intervention stool samples (FMP, n=10; MC, n=10) and MLNs (FMP, n=21; MC, n=16; 5 MLNs/mouse). The first two PCs from the PCoA are plotted. Symbols represent data from individual mice, color-coded by the indicated metadata. (d) Phylum-level phylogenetic classification of 16S rRNA gene sequences from pre-intervention (n=20) and post-intervention stool samples (FMP, n=10; MC, n=10) and post-intervention MLNs (FMP, n=21; MC, n=16; 5 MLNs/mouse). Pie charts represent the mean relative abundances of phyla across mice from each group. (e) Differentially abundant microbial clades in post-intervention samples from stool (FMP, n=10; MC, n=10) versus MLNs (FMP, n=21; MC, n=16; 5 MLNs/mouse). (f) Differentially abundant microbial clades in post-intervention MLNs of FMP- (n=21) versus MC (n=16)-fed mice. *, aerotolerant genera;+, genera shared between MLNs and deep colonic crypt communities (Pédron et al., 2012). For cladograms, white circles represent non-significant microbial clades.

