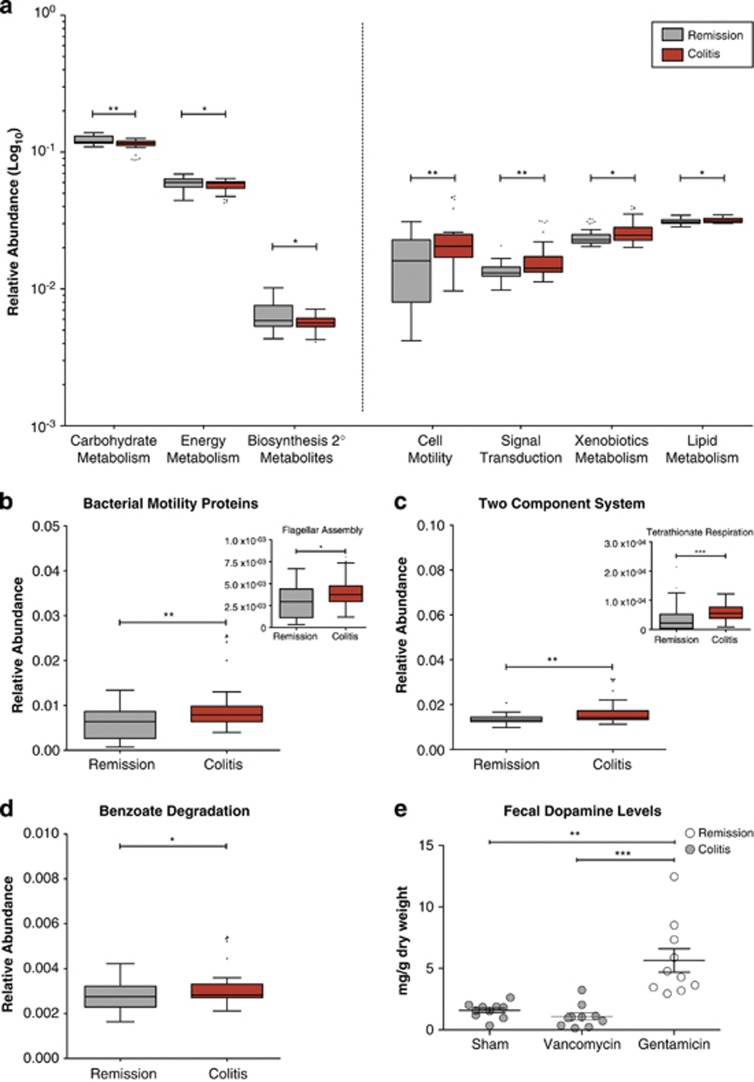
Figure 6.
Inferred gut microbiome functions associated with active colitis and treatment-induced remission. Relative abundances of KO gene families grouped into BRITE functional hierarchies, as inferred by PICRUSt from 16S rRNA gene sequences. Differentially abundant microbial functions associated with active colitis (n=31) versus remission (n=51) upon intervention completion organized by KEGG BRITE categories (a) and pathways (b–d). Boxplots denote top quartile, median and bottom quartile. Whiskers and outliers are plotted by the Tukey method. (e) ELISA-based determinations of fecal dopamine levels. Symbols represent data from individual mice from three independent experiments. Mann–Whitney test: *P<0.05; **P<0.01 and ***P<0.001.

