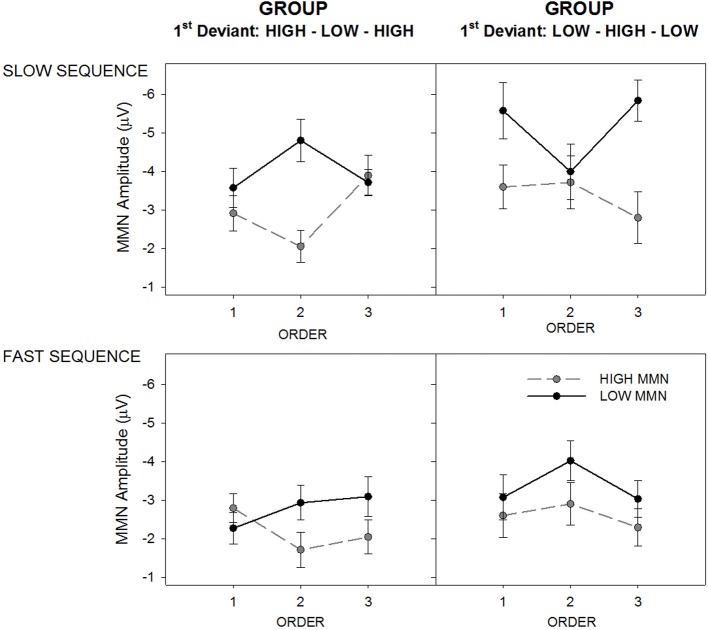
Figure 4.
Mean MMN amplitude for deviant high (gray/broken lines; “HIGH MMN”) and low (black full lines; “LOW MMN”) pitched tones, separately for the group hearing sequences with the High-Low-High 1st deviant order (left panels) and Low-High-Low 1st deviant order (right panels). The figure illustrates the MMN amplitude change across orders (x-axes), separately for the slow (top panels) and fast alternating sequences (bottom panels). Error bars represent standard error of the mean.

