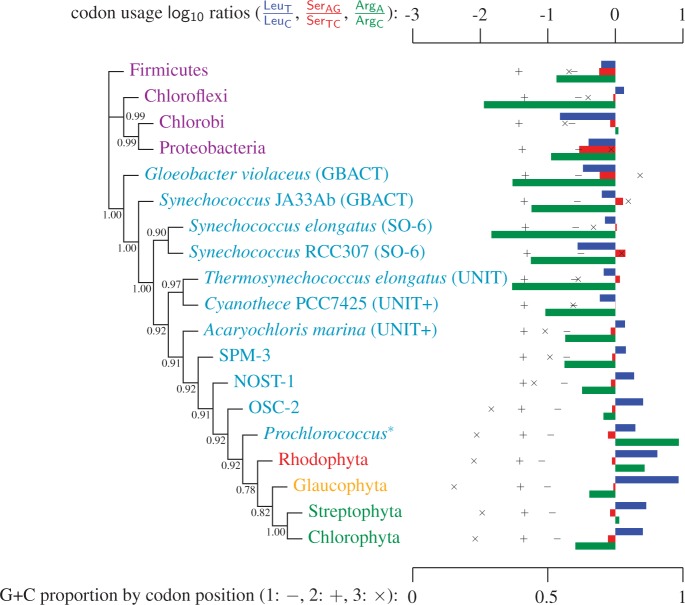
Fig. 3.
Simplified ML bootstrap tree for the recoded protein-coding gene data set “cg75_degen12S” and 50% majority-rule consensus tree of 200 ML ( ) bootstrap trees. Clades are labeled by their group label were possible. The codon usage bias and
  proportions at the three codon positions of the original “cg75” data set (i.e., without recoding) are presented to the right of the taxa (average values are given for summarized groups). This tree was chosen to display codon usage biases and G + C proportions because it seems to exemplify reconstruction errors induced by compositional effects. The topology of this tree somewhat correlates with composition and codon usages biases. Codon usage bias among Leu, Ser, and Arg is measured as the
  of the unbiased ratio between the usage of the two families of codons where the number of occurrences of codons of a family is divided by the number of possible codons in that family (2 or 4). Codon family labels:
  ,
,  ;
;  ,
,  ;
;  ,
,  ;
;  ,
,  ;
;  ,
,  ; and
; and  ,
,  . The codon bias representation is inspired by figure 1 of Inagaki and Roger (2006). Values above branches are BPs. Colors indicate taxonomic group (refer legend of fig. 1). *Prochlorococcus is an abbreviation of Prochlorococcus marinus (SO-6).

