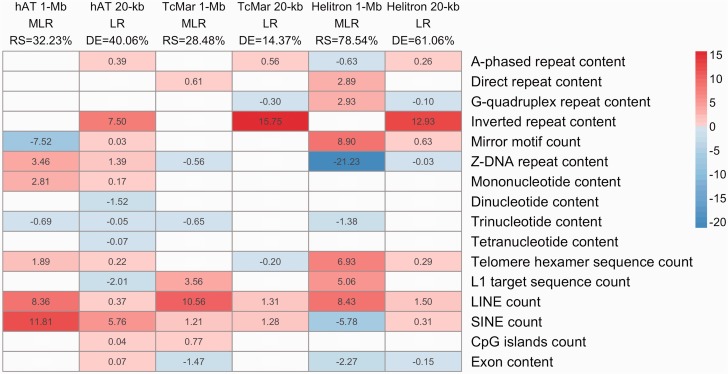
Fig. 2.
Effects of genomic features in various bat DNA transposon models. The intensity of the color is proportional to the RCVE of each predictor in each model, and the color encodes the sign of the effect—positive in red or negative in blue. White are not significant predictors. LR, logistic regression; RS, R-squared; DE, deviance explained.

