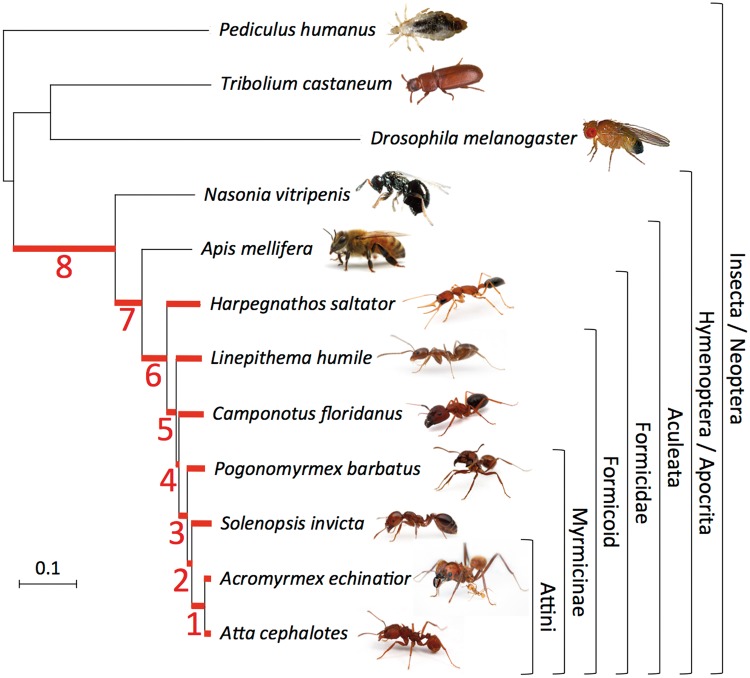
Fig. 1.
Phylogeny of the seven sequenced ant species and the five outgroups used in this study. The maximum-likelihood phylogeny was computed by R. Waterhouse from the concatenated alignment of the conserved protein sequences of 2,756 single-copy orthologs from OrthoDB (Simola et al. 2013). The scale bar indicates the average number of amino acid substitutions per site. The phylogeny is consistent with a previously published study (Brady et al. 2006). A second study only found a difference in the branching of Pogonomyrmex barbatus and Solenopsis invicta (Moreau et al. 2006). The 15 different branches where positive selection was tested are highlighted in red (the seven terminal branches leading to ant species and the branches numbered #1 to #8). The percentage of gene families showing positive selection in each of these branches at FDR = 10% is displayed in table 2. Illustrations of the seven ant species and Apis mellifera are courtesy of Alexander Wild at http://www.alexanderwild.com (last accessed April 24, 2014). Pediculus humanus illustration was downloaded from Vectorbase, Drosophila melanogaster, Tribolium castaneum, and Nasonia vitripennis illustrations were downloaded from Wikipedia. Illustrations are not to scale.

