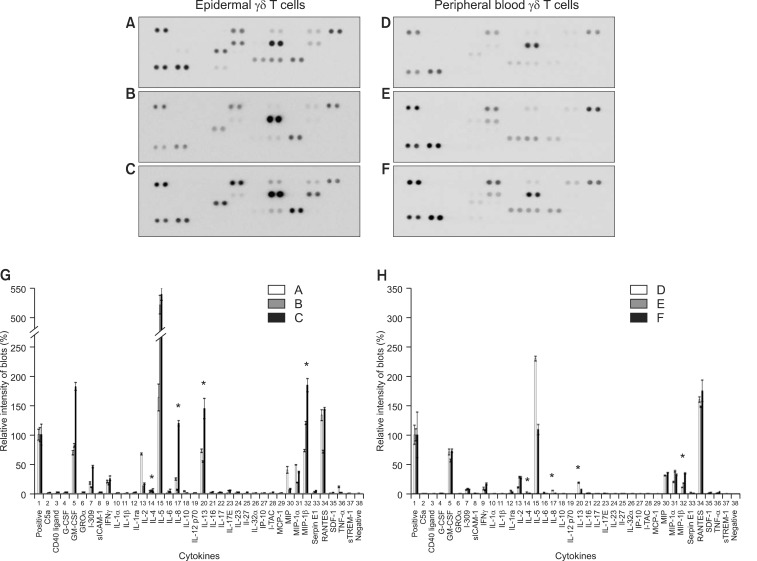
Fig. 2.
Comparison of cytokine expression profiles of epidermal and peripheral blood γδ T cells. Epidermal γδ T cells were isolated from the epidermes of three healthy volunteers (A~C) by using the method described in the Materials and Methods section. Peripheral blood γδ T cells were isolated from the peripheral blood of three healthy volunteers (D~F) by using conventional Histopaque 1077 gradient centrifugation, followed by magnetic-activated cell sorting. Epidermal and peripheral blood γδ T cells were stimulated using immobilized anti-CD3 antibody and IL-2 plus phytohaemagglutinin. The culture supernatants were analyzed after 36 hours by using the Human Cytokine Array Panel A. (A~F) cytokine array membranes. (G, H) The blot intensities on the array membranes were measured using a gel documentation system. Data are presented as the mean±standard deviation. Statistical analyses were performed using the Student's t-test. C5a: complement component 5a, G-CSF: granulocyte colony-stimulating factor, GM-CSF: granulocyte-macrophage colony stimulating factor, GROα: growth-related oncogene α, sICAM-1: soluble intercellular adhesion molecule-1, IFNγ: interferon-γ, IL: interleukin, IP-10: interferon gamma-induced protein 10, I-TAC: interferon-inducible T cell α chemoattractant, MCP-1: monocyte chemotactic protein 1, MIP: macrophage inflammatory protein, RANTES: regulated on activation, normal T cell expressed and secreted, SDF-1: stromal cell-derived factor 1, TNF-α: tumor necrosis factor α, sTREM-1: soluble triggering receptor expressed on myeloid cells 1. *p<0.05, epidermal vs. peripheral blood γδ T cells.

