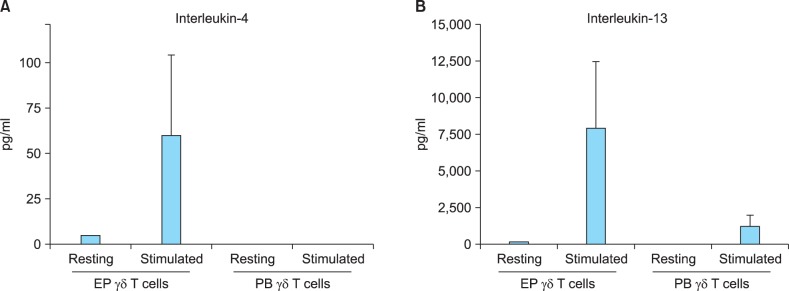
Fig. 3.

Quantitative analyses of interleukin-4 and interleukin-13 production in epidermal γδ T cells and peripheral blood γδ T cells. Epidermal and peripheral blood γδ T cells were each isolated from three healthy volunteers. Cells were stimulated using immobilized anti-CD3 antibody and interleukin-2 plusphytohaemagglutinin, or cultured without any stimulation. The culture supernatants were analyzed after 36 hours by using ELISAs. Data are presented as the mean±standard deviation of three independent experiments. Statistical analyses were performed using the Student's t-test. EP: epidermal, PB: peripheral blood. *p<0.05, epidermal vs. peripheral γδ T cells.
