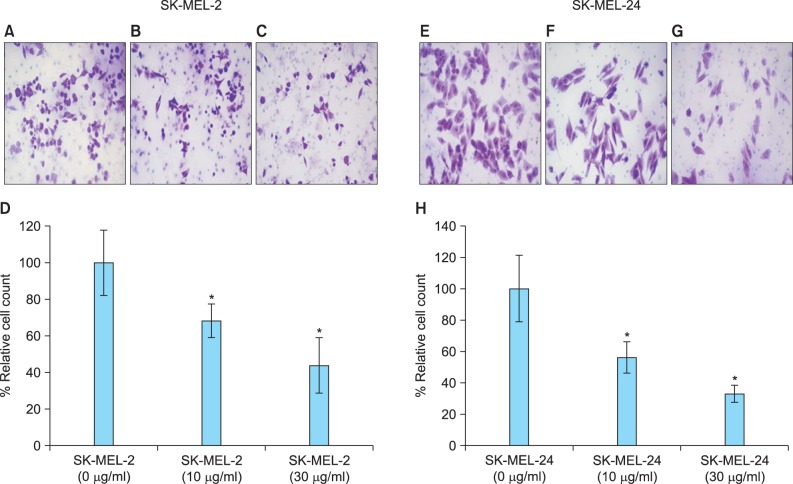
Fig. 2.
Invasion assay performed in SK-MEL-2 and SK-MEL-24 cell lines following imiquimod treatment. Suppression of SK-MEL-2 cell migration and invasion following incubation with a range of concentrations of imiquimod (A) 0 µg/ml, (B) 10 µg/ml, and (C) 30 µg/ml imiquimod (A~C: Coomassie stain, ×200). (D) The percentage of invasive SK-MLE-2 melanoma cells was significantly decreased with increasing concentrations of imiquimod (*p<0.05). Suppression of SK-MEL-24 cell migration and invasion following treatment with a range of concentrations of imiquimod (E) 0 µg/ml, (F) 10 µg/ml, and (G) 30 µg/ml imiquimod (E~G: Coomassie stain, ×200). (H) The percentage of invasive SK-MLE-24 melanoma cells was significantly decreased with increasing concentrations of imiquimod (*p<0.05). Con A: concanavalin A.

