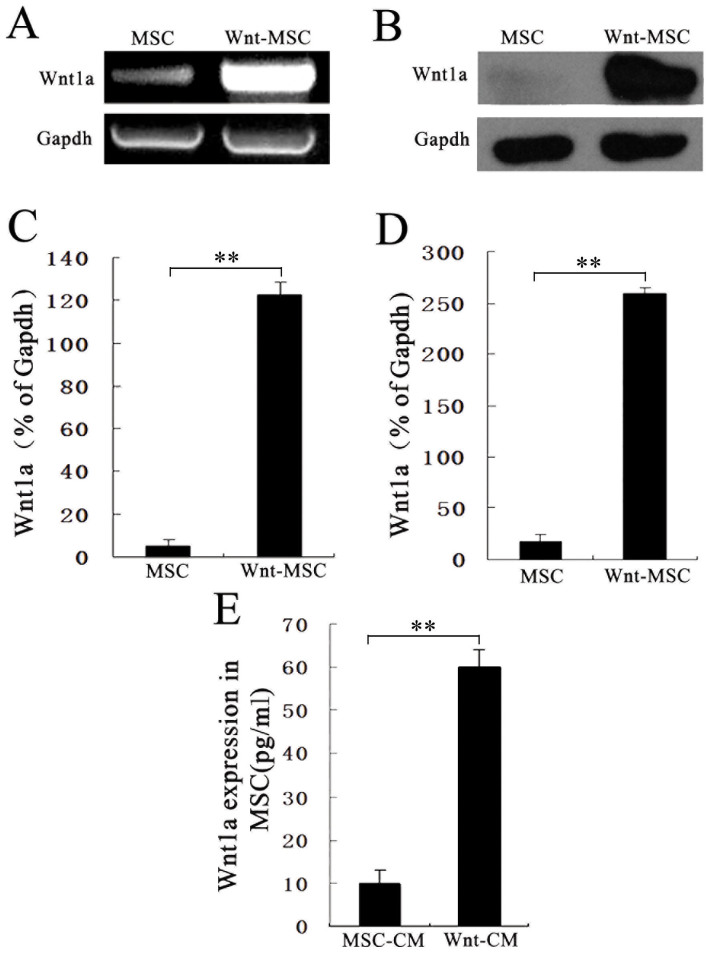
Figure 1. Wnt1a expression in BM-MSCs.
(A), (C) RT-PCR analysis of Wnt1a expression and corresponding semi-quantitative analysis data. (B), (D) Wnt1a expression was validated by western blotting using anti-Wnt1a antibody and corresponding semi-quantitative analysis data. (E) Wnt1a expression levels of condition media (CM) from Wnt-MSCs and MSCs were measured by ELISA. The Wnt1a expression was up-regulated in Wnt-MSCs compared with MSCs. The data represents the means ± SEM, n = 3. *P < 0.05.

