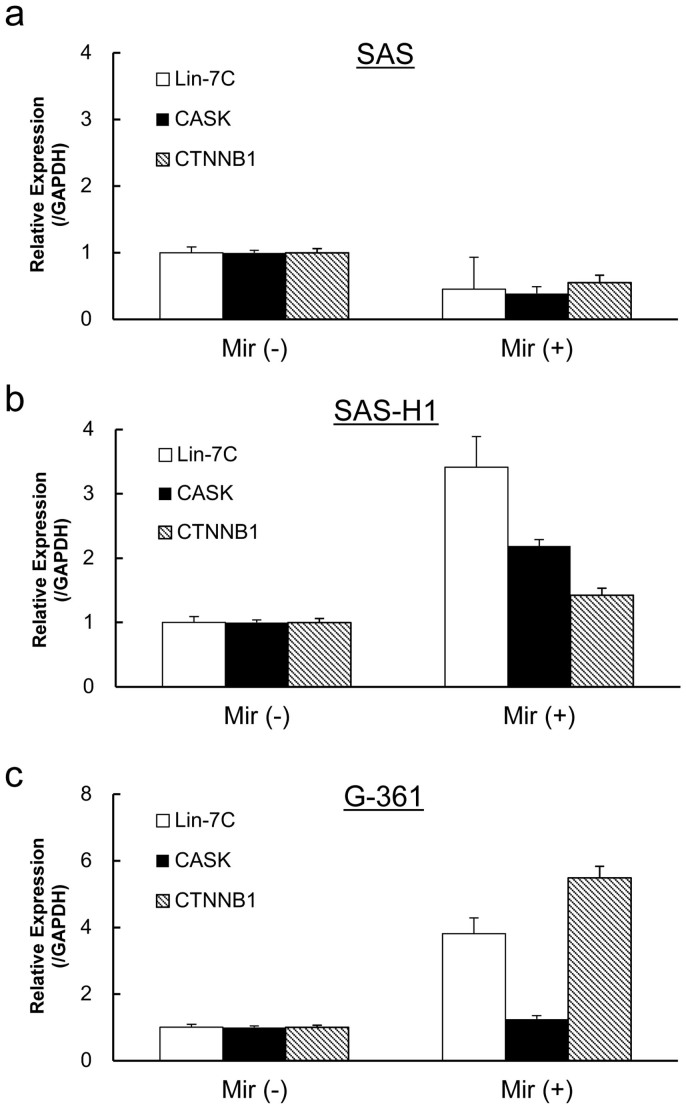
Figure 3. The effect of mirtazapine on Lin-7C, CASK, and CTNNB1 mRNA expression levels.
Treatment with mirtazapine (10 μM) is associated with up-regulation of the genes examined in the SAS-H1 (b) and G-361 (c) cells but not in those in the SAS (a) cells. The results are expressed as the means ± standard error of the mean of values obtained in triplicate. Mir (−) = without mirtazapine; Mir (+) = with mirtazapine.

