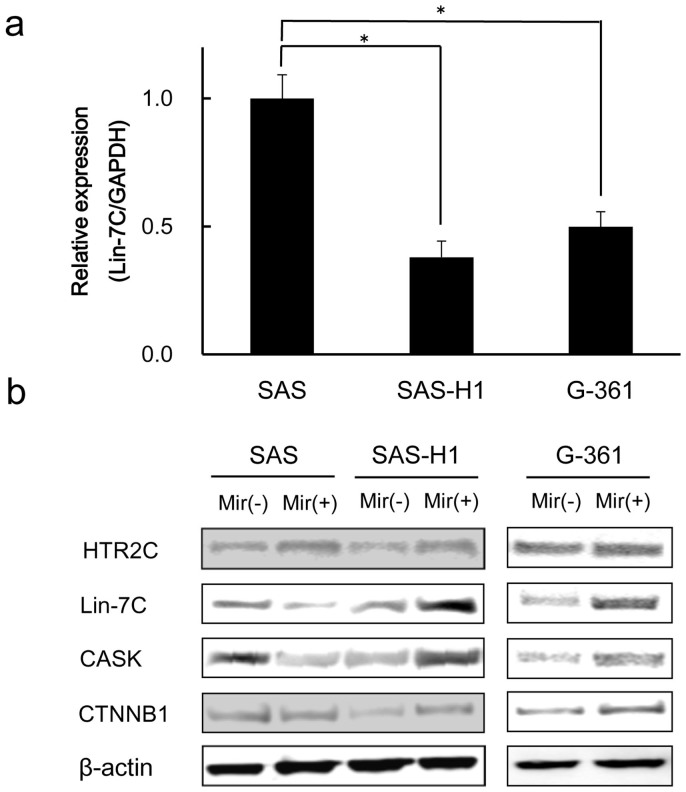
Figure 4. Functional analyses of Lin-7C gene in hSCC cells (SAS, SAS-H1) and malignant melanoma-derived cells (G-361).
(a) qRT-PCR shows that Lin-7C mRNA expression levels in the SAS-H1and G-361 cells are significantly (P < 0.05, Mann-Whitney U test) lower than that in the SAS cells. (b) Western blot analyses of HTR2C, Lin-7C, CASK, and CTNNB1 protein expression levels in SAS, SAS-H1, and G-361 cells with or without mirtazapine. Each blot is normalized to each of the β-actin protein levels. (The blots were cropped, and the full-length blots were included in the supplementary information). Mir (−) = without mirtazapine; Mir (+) = with mirtazapine.

