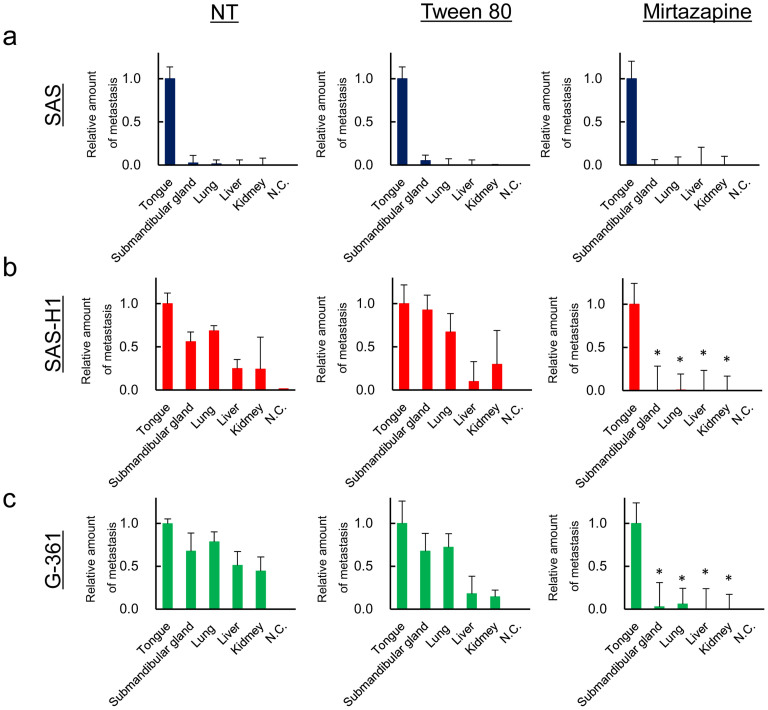
Figure 7. Quantitative analysis of spontaneous metastasis using different human tumor cells.
qRT Alu PCR is used to compare spontaneous metastasis of SAS, SAS-H1, and G-361 cells with mirtazapine treatment. The degree of metastasis is presented as the relative amount of metastasis normalized against murine GAPDH and as the actual number of human cells/tongue. While the control cells in the SAS-H1 and G-361 cells spontaneously metastasize into the submandibular glands, lungs, liver, and kidney, mirtazapine-treated cells in the SAS-H1 and G-361 cells are not seen in these organs, suggesting that mirtazapine inhibits micrometastasis. The asterisks indicate significant (P < 0.05, Mann-Whitney U test) differences between the control cells and mirtazapine-treated cells. NT = no mirtazapine treatment; N.C. = negative control without human genomic DNA.

