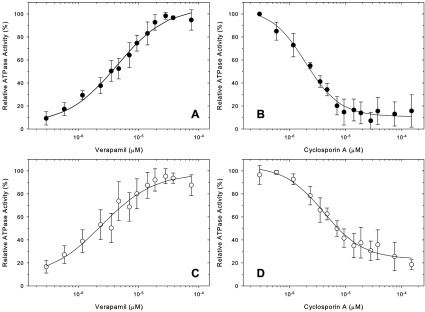
Figure 8. Stimulation and inhibition of ATPase activity of CL-Pgp and WT Pgp.

(A) WT and (C) CL-Pgp ATPase activity was assayed with purified proteins in the presence of increasing concentrations of verapamil. The solid lines represent non-linear regression analyses to the data points (see the Materials and Methods section) No cooperativity was observed with Hill coefficients close to 1.0 (1.04 and 1.00, respectively). Each data point represents the mean from at least three independent experiments±S.D.. (B) WT and (D) CL- Pgp purified proteins were assayed in the presence of 30 μM verapamil to maximally stimulate ATPase activity, but with increasing concentrations of the inhibitor cyclosporine A. The solid lines are non-linear regression fits, Hill coefficients were 1.40 and 1.22, respectively.
