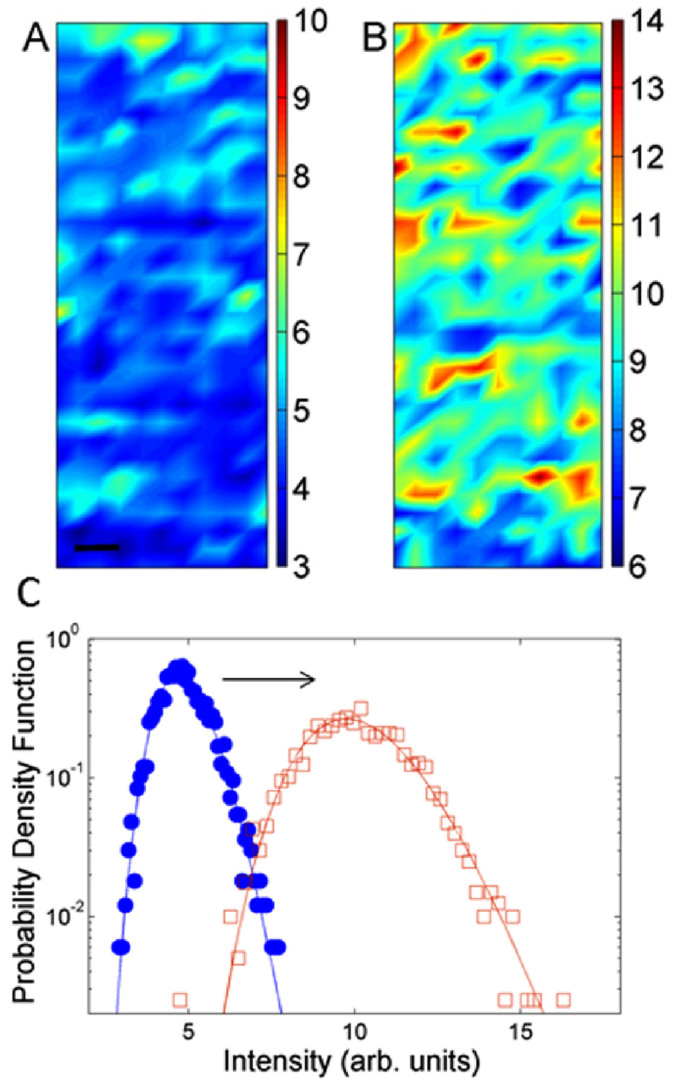
Figure 2.
Integrated intensity of X ray diffraction patterns measured pixel by pixel in a typical selected (40 × 120 µm) central area, of (A) native and (B) early degraded nerve. The bar corresponds to 10 µm. (C) Probability density function of Integrated intensity measured in the areas (A) and (B) for (full circles) native and (empty squares) early degraded nerve. Both distributions are fit by Lognormal lineshape (solid lines). The average intensity increases by a factor 2 in the early degraded nerve.

