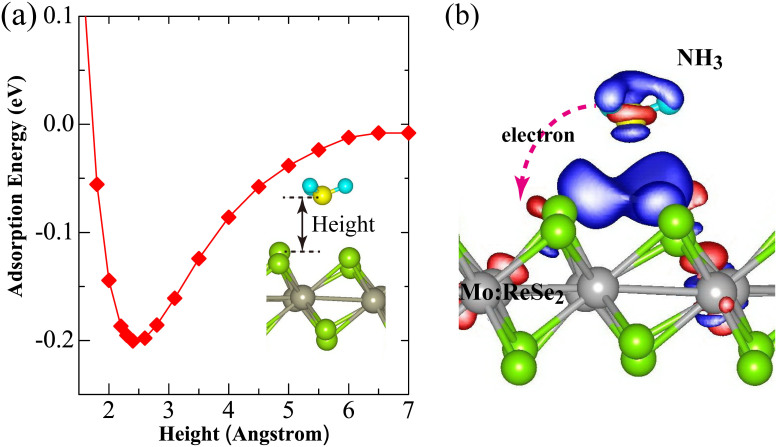
Figure 3. A NH3 molecule adsorbed on the Mo:ReSe2 monolayer.
(a) Adsorption energy as a function of height between the N atom of NH3 and the topmost Re atom of Mo:ReSe2. The Inset shows the stable adsorption configuration. (b) Charge density difference. Red and blue correspond to charge accumulation and depletion, respectively. The isosurface value is set to be 6×10⁴ e/ Å3. The arrow indicates the direction of charge transfer between the NH3 and Mo:ReSe2.

