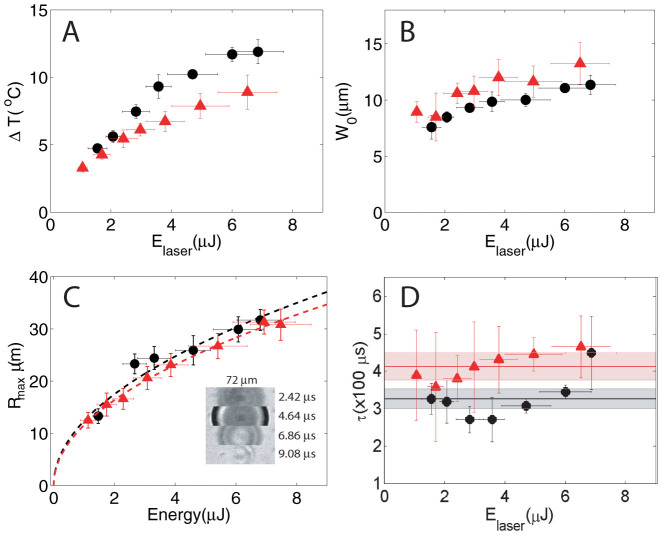
Figure 3.
(A) Maximum temperature rise ΔT as a function of the laser pulse energy (Elaser) for both chamber geometries. (B) Half width at half maximum of the initial temperature distribution after the bubble collapse (W0). (C) Maximum bubble radius Rmax as a function of laser energy obtained from experiments in bright field at 450,000 fps. The dashed lines,  , where a is the constant. Inset: sample of high speed video frames of a single cavitation event (microfluidic gap). (D) Time it takes the maximum temperature to drop by 1/e (τ) as a function of Elaser. Thin liquid gap: black circles, semi-infinite liquid: red triangles.

