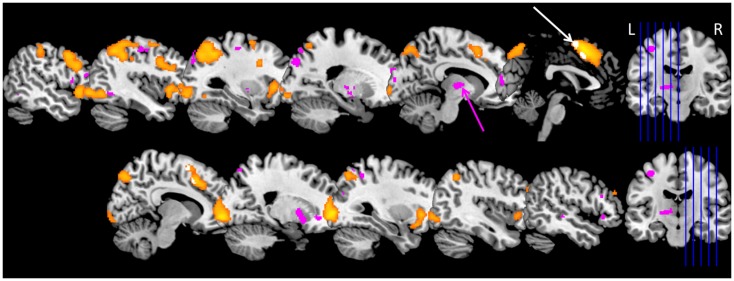
Figure 1.
Brain activation in Kleine–Levin syndrome (KLS) during working memory performance. The orange areas show typical working memory activation in the executive network in healthy individuals. Pink areas show regions with hyperactivation in KLS patients. The main finding of thalamic hyperactivation is marked with a pink arrow. The white arrow marks areas within the orange activation cluster in the anterior cingulate cortex and adjacent medial prefrontal cortex where KLS patients had less activation compared to the healthy control group. Data include 18 KLS patients and 18 matched controls (23).

