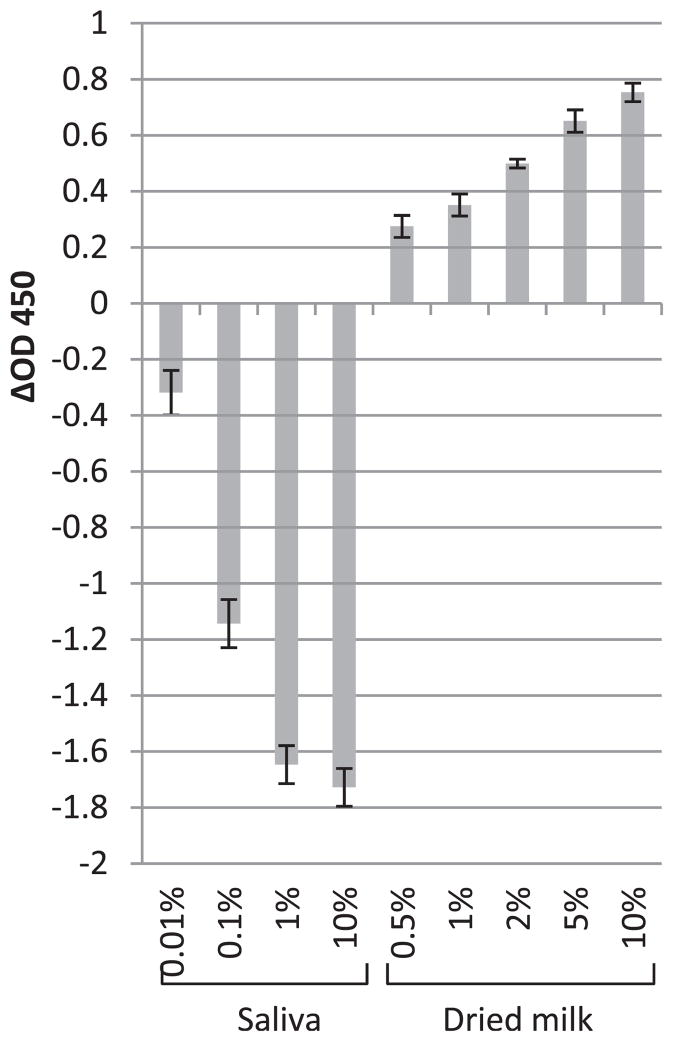
FIGURE 1.
The enhancements (positive values) or reductions (negative values) of NoV P particle detection in the presence of saliva or dried milk compared with PBS controls (P particles diluted in PBS) tested by saliva-binding ELISA. The x axis represents the concentration of saliva or dried milk; the y axis represents the enhancements or reductions of OD450 (ΔOD450). Each data point is an average of triplicates, and each error bar represents the data range.

