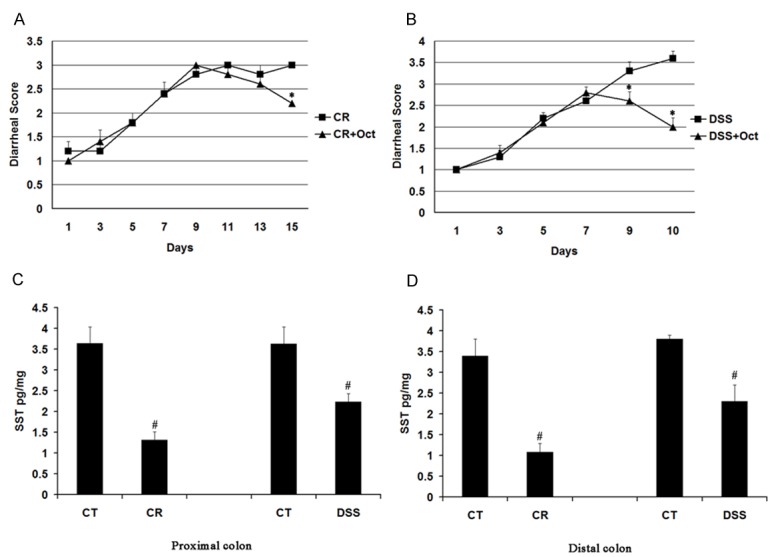
Figure 1.

Diarrhea scores and somatostatin assay in CR infected mice and DSS colitis mice. Mice were infected with CR or fed with DSS water before octreotide treatment. Diarrhea scores were recorded and somatostatin was measured. CT: control group; CR: CR infected group; DSS: DSS colitis group; Oct: Octreotide. Data are presented as mean ± SE from three groups of mice (3 mice/group). *p < 0.05 for treatment mice (Oct) vs. CR mice (CR) or DSS mice (DSS); #p < 0.05 for CR mice (CR) and DSS mice vs. control mice (CT). A: Diarrheal score in CR infected mice. B: Diarrheal score in DSS colitis mice. C: Somatostatin levels in the proximal colon. D: Somatostatin level in the distal colon.
