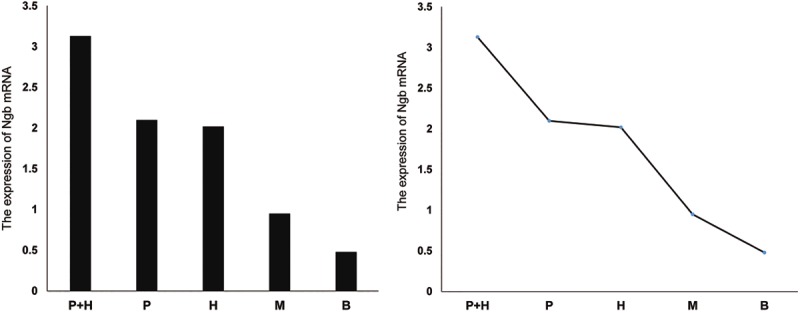
Figure 4.

Variation in the expression of Ngb mRNA in the rat cerebral tissues of each group. Rat cerebral cortex of indicated groups were obtained and total RNA were extracted and analyzed by RT-PCR using Ngb primers. P+H: Hemin and exogenous Ngb joint treatment group; P: Exogenous Ngb treatment group; H: Hemin treatment group; M: operation group; B: Blank control.
