
Figure 6.
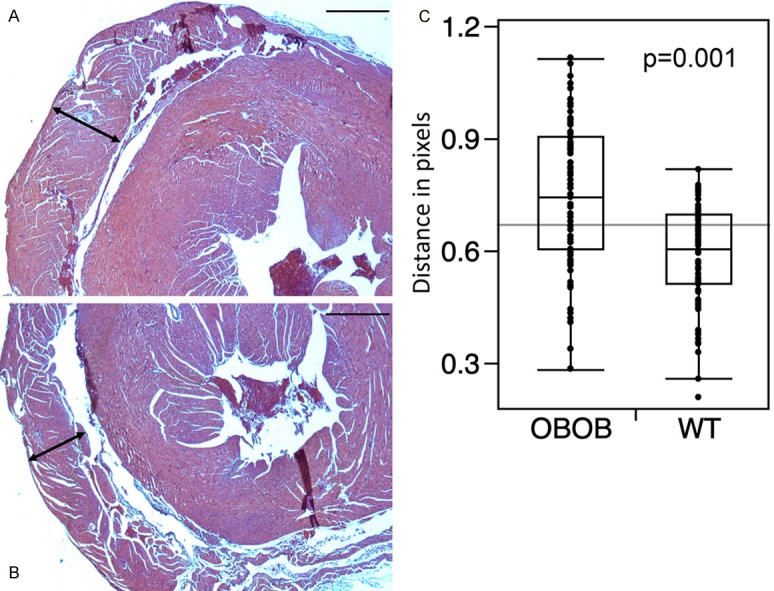
Transverse heart sections at the level of the left ventricular papillary muscles, showing right ventricle thickness (left-right arrows) in ob/ob (panel A) and wild type (panel B) mice. Panel C is a boxplot of the RV thickness measured in pixels, in 20 different sectors, on each slide for leptin deficient (ob/ob) and wild type (WT) mice. Bar indicates 100 μm.