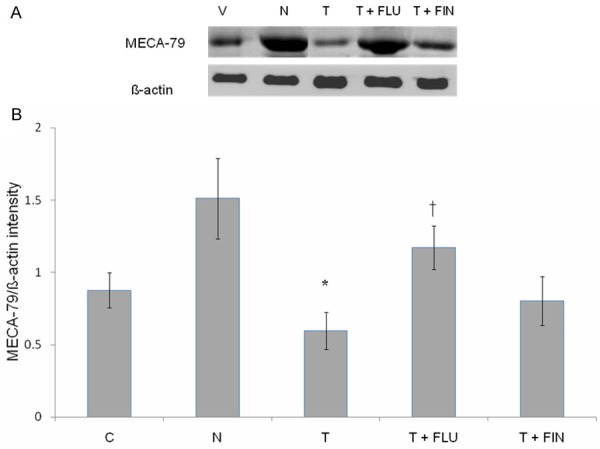
Figure 6.

Immunoblotting analysis of MECA-79 protein in different experimental group. (A) Shows immunoblot image of protein band in different experimental group while (B) Shows analyses of the intensity of protein bands in different experimental groups. Our findings indicate that the highest MECA-79 protein intensity was observed in the group received normal sex-steroid replacement while the lowest intensity was observed following administration of testosterone during the uterine receptivity period. Mean was obtained from intensity of 4 different membranes per treatment group. *P < 0.05 as compared to normal steroid replacement, †P < 0.05 as compared with testosterone only treatment. C: vehicle control, N: normal steroid replacement regime, T: testosterone only injection with P4, T + FLU: testosterone and flutamide administration with P4 and T + FIN: testosterone and finasteride administration with P4.
