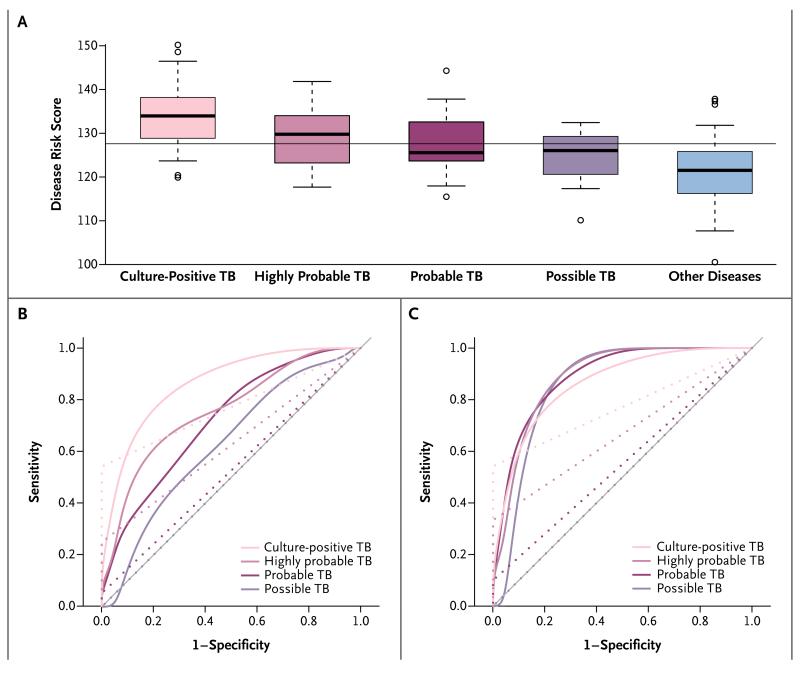
Figure 3. Risk Scores and Sensitivity and Specificity in the Kenyan Validation Cohort, According to Diagnostic Group.
Panel A shows the risk scores for tuberculosis according to study group, calculated with the use of a 51-transcript signature applied to the independent Kenyan validation cohort, in which culture-positive tuberculosis was reported in 35 patients, diseases other than tuberculosis were reported in 55 patients, and culture-negative tuberculosis was reported as highly probable in 5 patients, probable in 19 patients, and possible in 17 patients. The bar within each box indicates the median score, the bottom and top of the box indicate the interquartile range, the bars below and above the box are at a distance of 0.8 times the interquartile range from the upper and lower edges of the box, and the circles indicate outliers; the horizontal line across the graph indicates the mean score. Panel B shows smoothed receiver-operating-characteristic (ROC) curves for the sensitivity and specificity of the risk score (solid lines) and the Xpert MTB/RIF assay (dotted lines). Panel C shows ROC curves based on an adjusted analysis in which the actual prevalence of disease was assumed to be 80% among patients in whom the disease was highly probable, 50% among those in whom it was probable, and 40% among those in whom it was possible. Sensitivity and specificity are reported in Table S7 in the Supplementary Appendix.

