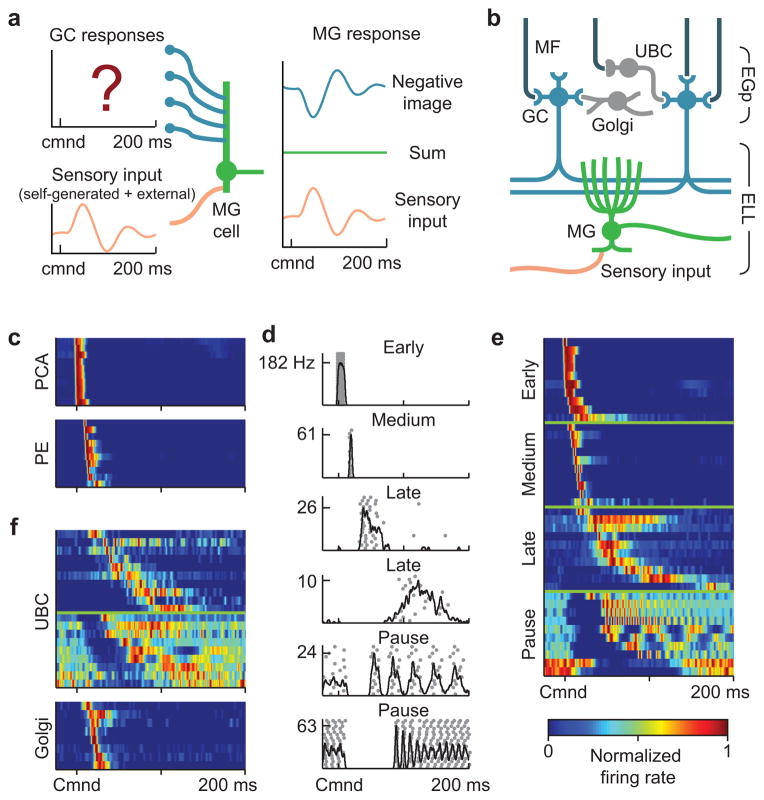
Figure 1. Corollary discharge responses in mossy fibers, UBCs, and Golgi cells.
(a) Schematic of negative image formation and sensory cancellation in a medium ganglion cell. The question mark indicates that temporal patterns of corollary discharge response in granule cells are the critical unknown in current models of sensory cancellation. (b) Schematic of the circuitry of the EGp and ELL. Corollary discharge signals related to the EOD motor command are relayed via several midbrain nuclei (not shown) and terminate in EGp as mossy fibers (MF, black inputs from top). UBCs give rise to an intrinsic system of mossy fibers that provide additional excitatory input to granule cells (GC). Golgi cells inhibit granule cells and UBCs. Medium ganglion (MG) cells in ELL receive both sensory input and granule cell input via parallel fibers. (c) Corollary discharge responses of units recorded in the paratrigeminal command associated nucleus (PCA) and the preeminential nucleus (PE). Each row shows the smoothed (5 ms Gaussian kernel) and normalized average firing rate of a single unit. In this and subsequent figures time is defined relative to the EOD motor command (Cmnd), which is emitted spontaneously by the fish at 2–5 Hz. Color bar in e applies also to c and f. (d) Example spike rasters (grey dots) and smoothed firing rates (black curves) for putative mossy fibers recorded extracellularly in EGp illustrating four temporal response classes (early, medium, late, and pause). (e) Corollary discharge responses of putative mossy fibers recorded extracellularly in EGp. Each row represents the smoothed and normalized average firing rate of a single mossy fiber, with 10 examples of each class shown. (f) Corollary discharge responses of UBCs (n = 19) and Golgi cells (n = 8) recorded intracellularly. Each row represents the smoothed and normalized average firing rate of a single cell. Note the similarity with late and pause mossy fibers, shown in e.

