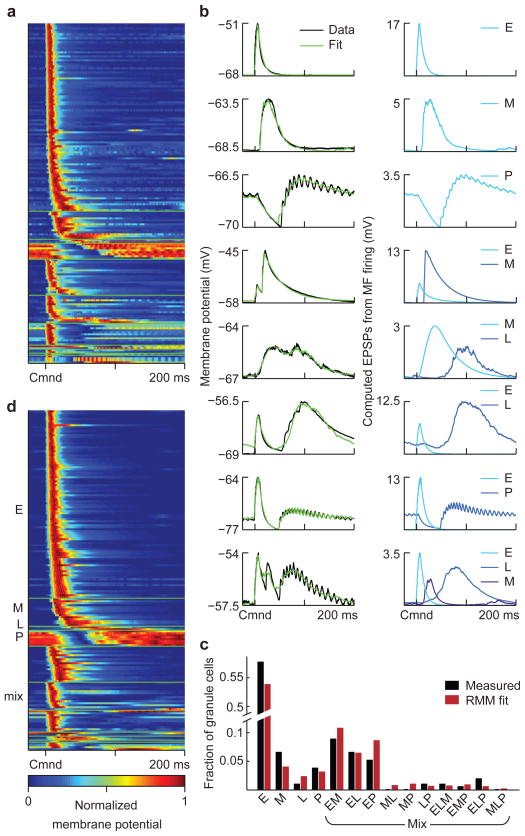
Figure 3. Experimental characterization and modeling of corollary discharge responses in granule cells.
(a) Average subthreshold corollary discharge responses of 170 granule cells. Responses are grouped by category (see d) and then sorted by the latency of their peak membrane potential. (b) Left, examples of recorded granule cell subthreshold responses (black trace) and model fits (green). Right, EPSPs computed from the recorded mossy fiber inputs used to fit each granule cell, labeled according to the class to which they belong. (c) The distribution of response categories assigned to recorded granule cells based on model fits (black bars). Bars labeled E, M, L and P indicate the fraction of early, medium, late and pause inputs used to fit the recorded granule cell responses. “Mixed” bars show these fractions for combinations of inputs used in the same way. These fractions are consistent with a four-parameter random mixing model (RMM; parameters are the probability of early, medium, late, and pause inputs) in which each input to a granule cell is assigned independently of the others (red bars). This suggests that the combinations of inputs granule cells receive are random. (d) Average subthreshold corollary discharge responses of 170 randomly constructed model granule cells selected from a total of 20,000. In this sample, the number of model cells from each granule cell category was matched to the experimental data, but the selection process was otherwise random. Note that the temporal response properties of the model granule cells closely resemble those of the recorded granule cell shown in a.

