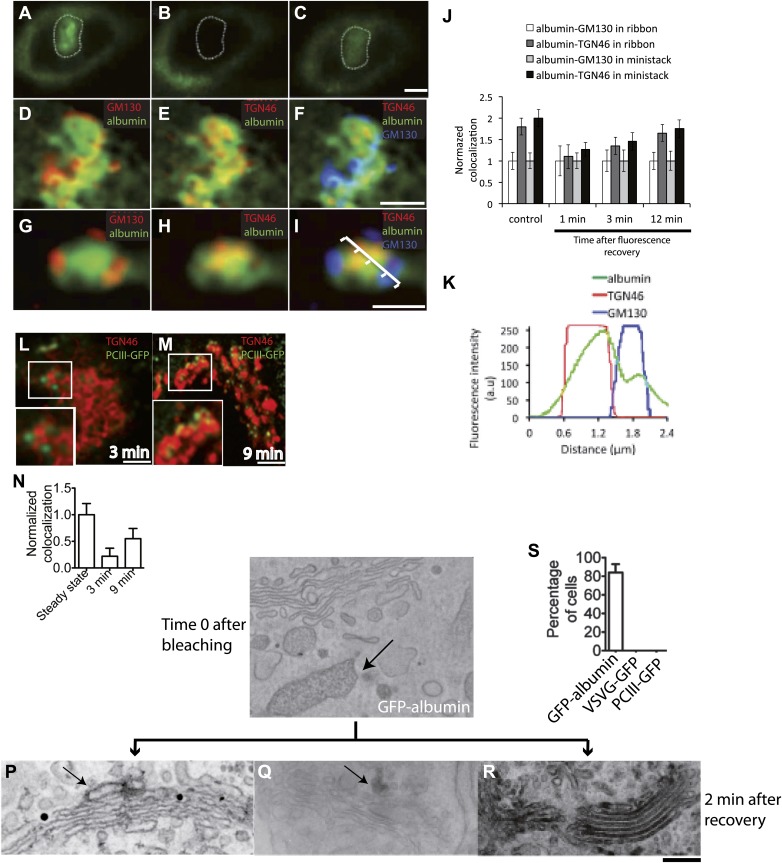
Figure 3. Kinetic patterns of transport of GFP-albumin, VSVG-GFP and PC-III-GFP through the Golgi stack under steady-state conditions.
HeLa cells were transfected with GFP-albumin (A–K) or PC-III-GFP (L–N). After 16 hr of transfection, the Golgi area was bleached, and entry of these cargoes from the unbleached periphery (ER) into the Golgi area was monitored by FRAP. The cells were then fixed at different time points, stained for GM130 and TGN46, and re-localized for analysis of co-localization of the GFP-tagged cargoes with these Golgi markers. (A–C) Bleaching of the Golgi area, as delineated by the dotted line, with post-bleaching recovery for 1 min (C). (D–F) Detail of the same Golgi area shown in (C), showing co-localization of GFP-albumin (green) with GM130 (D, red), or TGN46 (E, red) or both (F: GM130, blue; TGN46, red). (G–I) Similar experiments carried out on a nocodazole-induced Golgi ministack ('Materials and methods'), with 1-min post-bleaching co-localization of GFP-albumin (green) with GM130 (G, red) or TGN46 (H, red) or both (GM130, blue and TGN46, red) (I). (J) Quantification of the degree of co-localization of GFP-albumin with GM130 and TGN46 at different time points after bleaching, as illustrated in (A–F). These data are expressed by normalizing the degree of co-localization of GFP-albumin in the TGN46 area to that of albumin in the GM130 area (set to 1). (K) Line scan along the arrow across the Golgi ministack shown in (I). The fluorescence intensities from representative points along the distance were plotted. (L and M) Cells were transfected with PC-III-GFP. The Golgi area (within the dotted line) was bleached, and the time course of entry of PC-III-GFP to the TGN was monitored. The cells were fixed and stained for TGN46 at 3 min (L) and 9 min (M) post-bleach, and the overlap between PC-III-GFP with TGN46 was examined. (N) Quantification of data in (L and M), expressed as mean ± SD from at least three independent experiments. (O–S) To ascertain the earlier observations of rapid filling of the Golgi stack by GFP-albumin (A–F), we resorted to electron microscopy. HeLa cells were transfected with GFP-albumin (O and R) or VSVG-GFP (P) or PC-III-GFP (Q). The Golgi localized fluorescence was bleached as before (time 0; O) and entry of cargo into the Golgi area monitored by FRAP and the cells fixed 2 min after recovery. The GFP fluorescence was then converted to a signal visible at the EM by photooxidation (see 'Photooxidation' under 'Materials and methods' section) using Diaminobenzidine (DAB). The DAB product is indicated by arrows. At time 0 the DAB product is present only in the ER with Golgi devoid of staining (O). After 2 min of fluorescence recovery, both VSVG-GFP (P) and PC-III-GFP (Q) are restricted to the cis-side of the Golgi, while GFP-albumin (R) is present throughout the Golgi. In the case of VSVG-GFP, DAB precipitate is visible outside of the Golgi cisternae because GFP is attached to the cytosolic tail of VSVG. In addition, nanogold labeling for Mannosidase II was done in (P) that marks the medial-part of the Golgi. The time 0 image shown is from cells expressing GFP-albumin; similar staining was obtained from both VSVG-GFP and PC-III-GFP expressing cells at time 0. (S) The percentage of cells that showed DAB product throughout the Golgi 2 min after recovery was calculated and presented as mean ± SD. Bar: 2 μm (A–M), 220 nm (O–R).


