Figure 3.

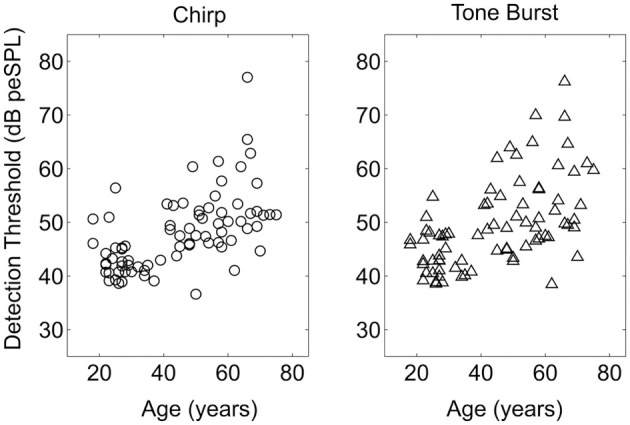
Single stimulus detection thresholds plotted as a function of age of the listener for the Chirp and Tone Burst stimuli. Thresholds plotted are the average of the thresholds for the left and right ears.

Single stimulus detection thresholds plotted as a function of age of the listener for the Chirp and Tone Burst stimuli. Thresholds plotted are the average of the thresholds for the left and right ears.