
Figure 2.
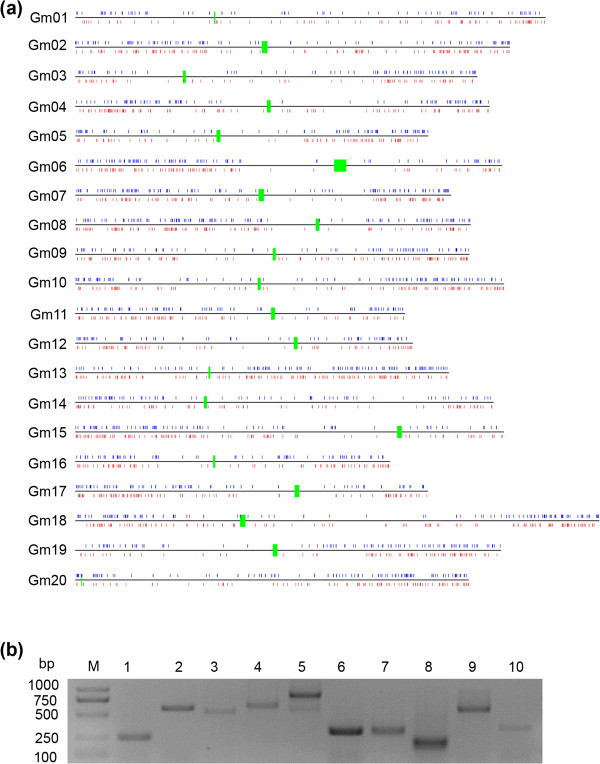
Discovery of NTRs. (a) Genome-wide distribution of nTUs plotted at their mapped chromosomal positions. Green shows centromere region, while blue and red show nTUs on the positive and negative strand, respectively. (b) Validation of the 10 randomly selected nTUs by RT-PCR.