
Figure 5.
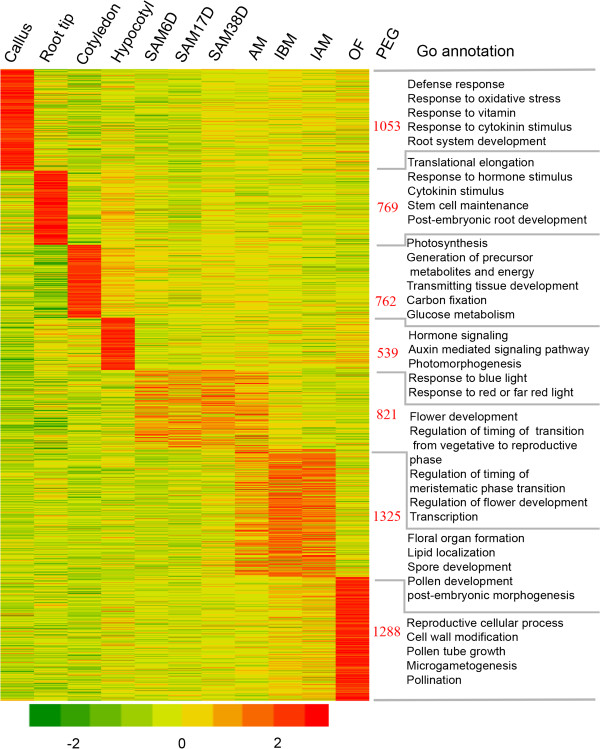
Tissue preferentially expressed genes in 11 examined tissues of soybean. The heatmap visualized the self-division of preferentially expressed genes in individual or grouped tissues. Color gradient illustrated the Z-scores of the gene expression values by calculating as the mean-centered log2 (RPKM) values divided by the standard deviation for each gene, separately. Right to the heatmap showed the number of preferential genes and selected significantly enriched GO terms (P < 0.001).