
Figure 7.
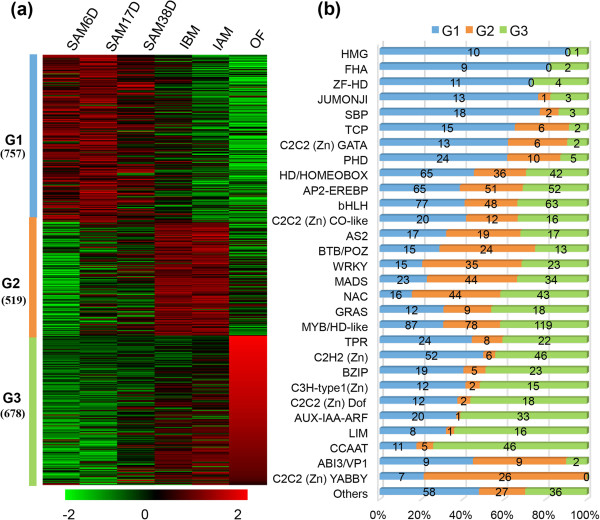
Dynamics of transcription factor profiles. (a) Dendrogram of the transcription factors. 1,954 differentially expressed transcription factors from the six tissues (RPKM > 1 in at least one segment) clustered into three lineages (G1, G2 and G3) using the K means-clustering method. (b) Distribution of transcription factor families among G1, G2 and G3.