
Figure 2.
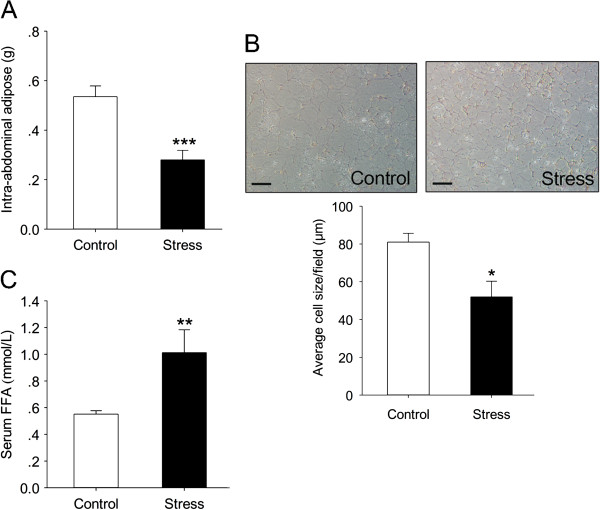
Characterization of intra-abdominal adipose tissue and serum FFA of chronic stress mice. (A) Weight of intra-abdominal adipose tissues from the control and stress mice received 12 weeks stress protocol. Error bars represent standard error (SE) (n = 10). (B) HE staining of intra-abdominal adipose tissue of stress mice received 12 weeks stress protocol. Magnification, ×100. Scale bars: 50 μm. Average cell sizes were calculated by Image J (C) Serum FFA content. Error bars represent standard error (SE). **P < 0.01, ***P < 0.001 versus control mice.