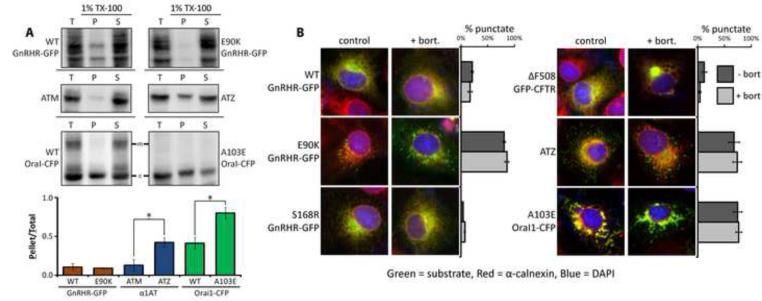
Figure 2. Analysis of the E90K aggregation state.
(A) Analysis of disease protein solubility in the non-ionic detergent Triton X-100. Cos-7 cell extracts were prepared in lysis buffer supplemented with 1% Triton X-100 and spun at 4°C at 20,000xg for 15 min: total (T), pellet (P), and supernatant (S). Mature glycosylated Orai1-CFP is indicated (#). Proteins were detected by western blot and the ratio of pellet to total was quantified for 3 experiments and graphed +/− SEM. Asterisks (*) indicate p<0.05 via a students t-test. (B) Fluorescence analysis of disease proteins localization in fixed Cos-7 cells. GFP fusion proteins were detected in the green channel. ATZ (green) was detected by immunofluorescence, and so was the ER marker calnexin (red). One hundred cells per slide were scored for the presence of puncta and cells that contained >10 puncta were judged as punctate. Asterisks (*) indicate a p<0.05 in a t-test, N=3. Green and red channels are shown unmerged in Figure S2.

