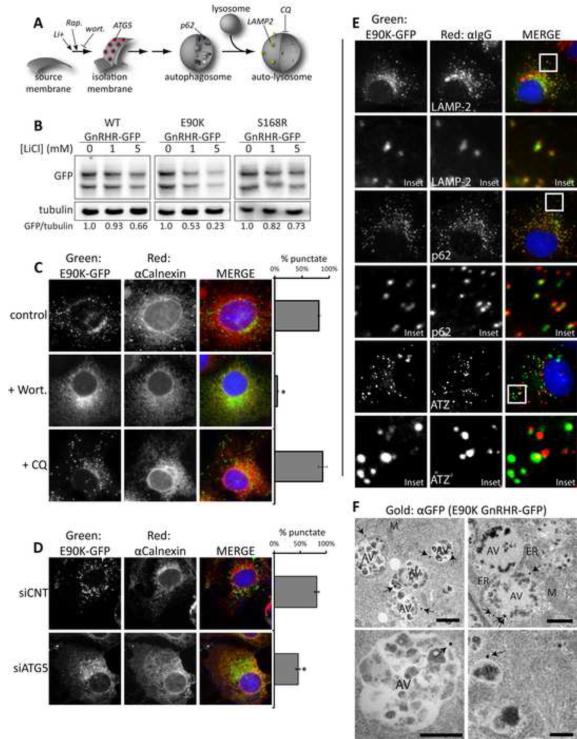
Figure 3. E90K puncta colocalize with autophagic markers and localization is sensitive to chemical and genetic inhibitors of autophagy.
(A) Model pathway for autophagosome formation. Sites of action for CQ, Wortmannin (wort), rapamycin (Rap), and lithium chloride (LiCl) are shown. (B) Impact of LiCl on steady-levels of indicated disease proteins as determined by western blot. Cells were treated with for 18 hr prior to lysis of Cos-7 cells. C-E show fluorescence micrographs of Cos-7 cells treated as indicated. (C) The impact of Wort and CQ on the accumulation of E90K in puncta. (D) The impact of siRNA KD of ATG5 on the accumulation of E90K in puncta. One hundred cells per slide were scored for the presence of puncta and cells that contained >10 puncta were judged as punctate. Data are represented as mean +/−SEM. Asterisks (*) indicates a p<0.05 in a t-test ; n=3. (E) Localization of E90K in relation to autophagic markers. Cells immunostained for LAMP-2 (lysosome marker), or p62 (autophagy marker) are shown. Additionally, cells co-expressing E90K and ATZ were immunostained with α1AT. Insets show colocalization of LAMP-2 and p62 with E90K puncta. (F) Immunogold transmission electron microscopy (TEM) of Cos-7 cells expressing E90K GnRHR-GFP. Immunogold staining was performed against the GFP tag and gold particles are indicated with arrows. Mitochondria (M), endoplasmic reticulum (ER), nuclei (N), and autophagic vesicles (AV) are labeled. Scale bar = 1 μM. See also Figures S2 and S3.

