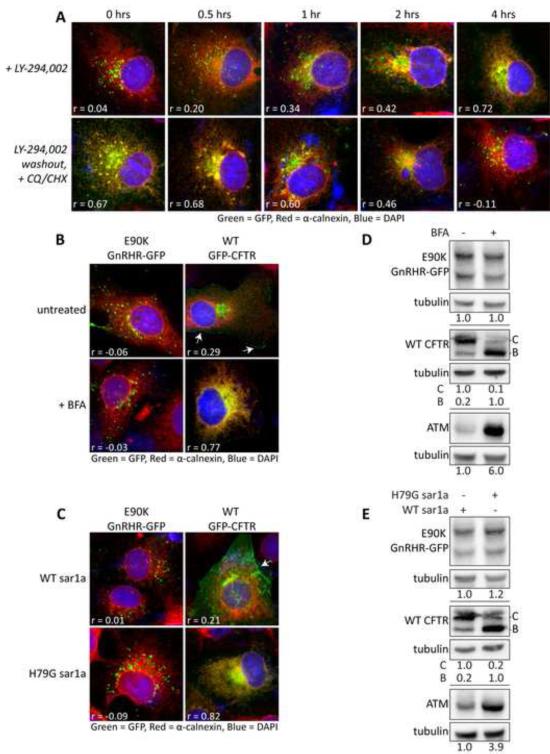
Figure 4. E90K puncta formation and protein levels are not affected by ER-golgi trafficking inhibition.
(A) Effects of LY-294002 treatment and washout on E90K localization in Cos-7 cells. After 4 hours of treatment with LY-294002, media was removed and replaced with media containing 10μg/ml CHX and 15μM CQ. (B) Effects of the ER-golgi transport inhibitor Brefeldin-A (BFA) on levels of E90K, WT CFTR, or α1AT M-variant (ATM). (C) Effects of overexpression of a dominate negative mutant (H79G) of Sar1a on levels of E90K, WT CFTR, or α1AT M-variant (ATM). Panels B and C show western blots of Cos-7 cells transiently transfected on E90K GnRHR-GFP, WT CFTR, or α1AT M-variant (ATM). CFTR blots show core-glycosylated (B-band) and mature-glycosylated (C-band). (D) Effects of the ER-golgi transport inhibitor Brefeldin-A (BFA) on localization of E90K and GFP-CFTR. (E) Effects of overexpression of a dominate negative mutant (H79G) of Sar1a on localization of E90K and GFP-CFTR. Fluorescence micrographs of Cos-7 cells transiently transfected with substrates are shown in A, D and E. Cell surface localization of CFTR is shown with arrows. Pearson's correlation coefficients (r) between calnexin (Red) and GFP (Green) signal are shown. DAPI staining is shown in blue. Data are represented as mean +/−SEM.

