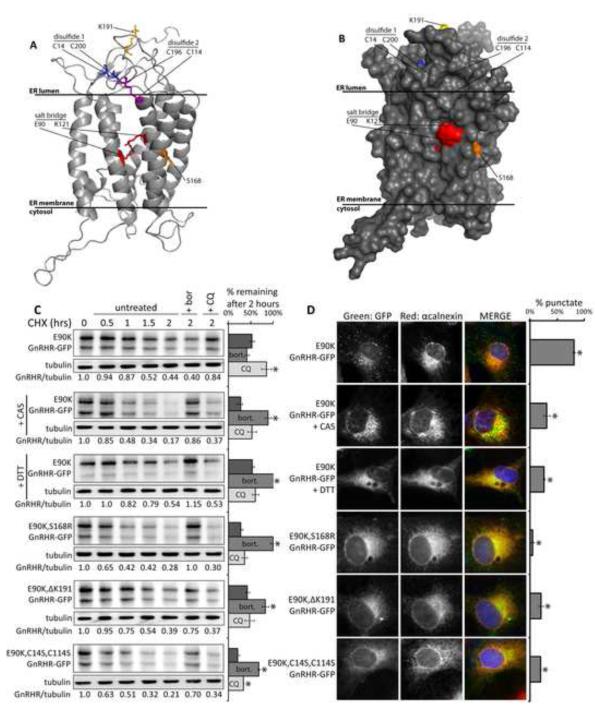
Figure 5. Interference with GnRHR folding impacts triage of E90K.
(A) Ribbon diagram of a GnRHR homology model (Jardon-Valadez et al., 2008). (B) Space filling model of the GnRHR structure. (C-D) Effects of 5mM castanospermine (CAS), 2mM DTT (4 hour pre-treatment), and second-site mutations in GnRHR on the half-life and localization of E90K. Cos-7 cells were treated with 10μg/ml CHX, 10μM bort., or 15μM CQ at t=0. Bar graphs show the relative amounts of protein remaining at 2 hours. Asterisks (*) indicate a p<0.05 in a t-test. Half-life curves are shown in Figure S5D. E90K localization was determined by fluorescence microscopy of cells treated as described. 100 cells/slide were scored for the presence of puncta. Asterisks (*) indicates p<0.05 in a t-test; N=3. See also Figure S5. Data are represented as mean +/−SEM.

