
Fig. 2.
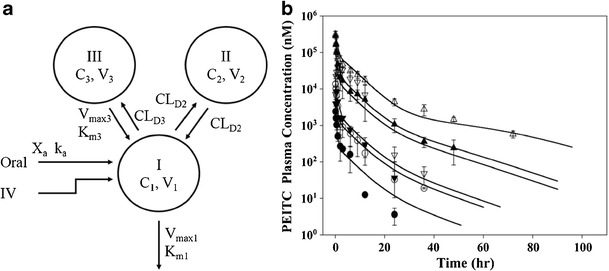
a Mechanistic pharmacokinetic model of unchanged phenethyl isothiocyanate after intravenous and oral administration and b the observed and predicted concentrations of PEITC. a X a represents the drug amount at the absorption site; C 1, C 2, and C3 represent the plasma concentrations of PEITC in central (I) and two peripheral compartments (II and III), respectively; V 1, V 2, and V 3 represent the volume of distribution of PEITC in central (I) and two tissue compartments (II and III), respectively; k a is the absorption rate constant; K m1 and V max1 are the Michaelis-Menten parameters to characterize clearance from the central compartment indicative of capacity-limited metabolism; CL D2 represents distribution clearance between the tissue compartment (II) and central compartment characterized by linear clearance. CL D3 represents distribution clearance from the central compartment to the tissue compartment (III); K m3 and V max3 are the Michaelis-Menten parameters to characterize from the tissue compartment (III) to the central compartment, indicative of transporter-mediated clearance. b Rats were dosed with 2 (closed circles), 10 (open circles), 100 (closed triangles), or 400 mmol/kg (open triangles) of PEITC intravenously or 10 (inverted closed triangles) and 100 mmol/kg (inverted open triangles) orally. Data are expressed as mean ± SD, n = 3 or 4. All the data were fitted simultaneously by ADAPT II, and the lines represent predicted plasma PEITC concentrations using the proposed compartmental model. b Reproduced with permission from Springer from Ji et al. (16)