
Fig. 5.
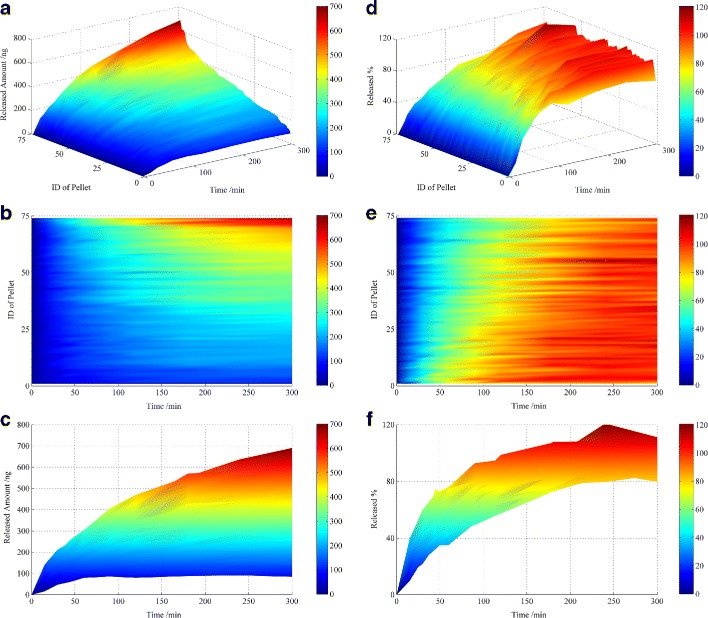
Single pellet release profile for released amount (a–c) and released percent (d–f); 3D surface plot (a, d), top view (b, e) and front view (c, f). The colour legend (bar on the right) refers to the amount of drug released (ng) in a–c and the cumulative release percentages (%) in d–f