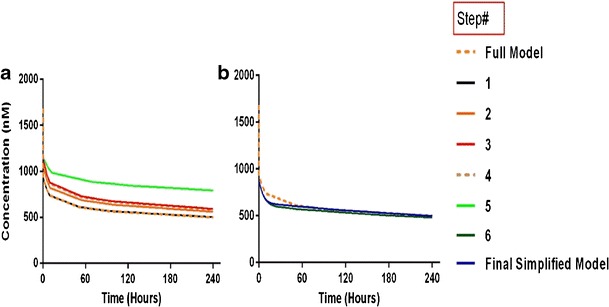
Fig. 5.

Simulations comparing the effect of consecutive simplifying assumptions on plasma concentrations. Concentrations are shown on linear scale. For Steps 6 and 7, amount of drug in plasma is calculated as a proportion of the drug in the central (i.e., vascular and plasma) compartments
