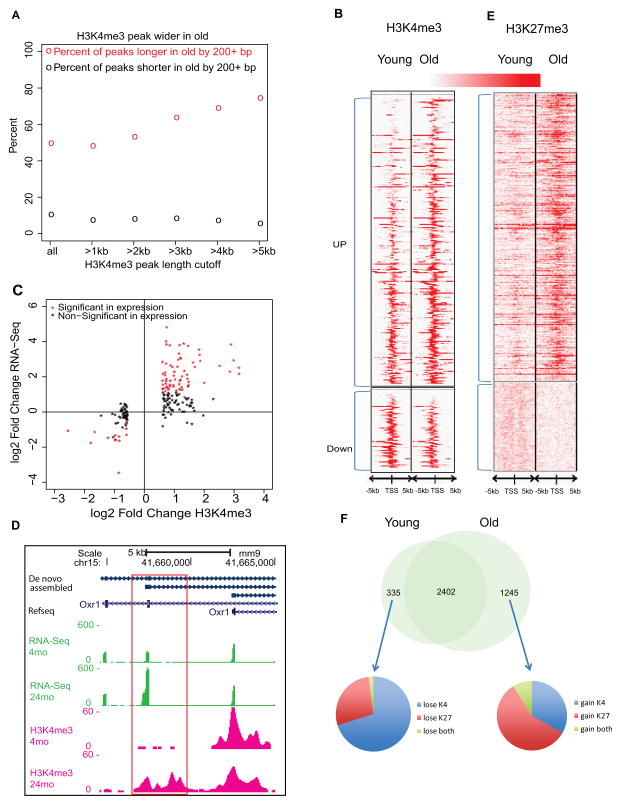
Figure 3. Histone modifications changes with HSC aging.
(A) Percent of H3K4me3 peaks getting longer or shorter (>200bp) in old HSCs. The x-axis is the peak-length cutoff to be counted toward lengthening or shortening. The y-axis is the number of wider or shorter peaks divided by total number of peaks at the length cutoff. The circles represent the percent of lengthening (red) and shortening (black) events.
(B) Heatmap of H3K4me3 density around promoters that show significantly different H3K4me3 binding with age (Poisson P-value 10−8).
(C) The correlation between gene expression and H3K4me3 signals for the significantly different H3K4me3 binding genes. The X-axis denotes the log2 fold change of H3K4me3 ChIP-Seq read counts in the defined promoter region and the Y-axis denotes the log2 fold change of FPKM value for the gene.
(D) Genome browser view on the Oxr1 gene body. Boxed area shows new promoter with H3K4me3.
(E) Heatmap of H3K27me3 density around promoters that show significantly different H3K27me binding with age.
(F) Venn diagram showed bivalent domains change with HSC aging.
See also Figure S3

