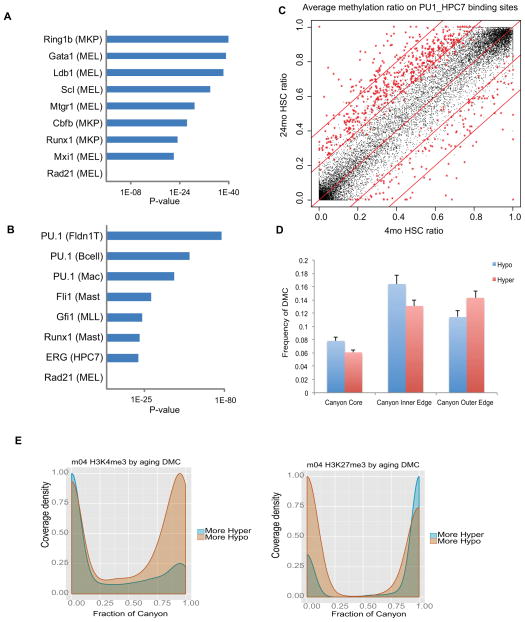
Figure 6. DNA methylation changes interact with transcriptional network.
(A) Hypo-DMRs are enriched for the indicated transcription factor binding sites. Parentheses () identify the cell type or cell line in which the TF binding sites were originally identified. MKP: Megakaryocyte progenitors; MEL: Murine erythroleukemia cell line.
(B) Hyper-DMRs are enriched for transcription factor binding sites in distinct blood lineages. Parentheses () identify the cell type or cell line in which the TF binding sites were originally identified. FLDN1_T: Fetal Liver DN1 T cell; Mac: Macrophage; Mast: Mast cells; MLL: MLL/ENL-expressing preleukemia cells; MEL: Murine erythroleukemia cell line.
(C) Scatter plot comparing the methylation ratio for all the Pu.1 binding sites identified in the HPC7 cell line between 4mo HSC and 24mo HSC. Red symbols indicate binding sites with methylation ratios significantly changed between 4mo HSC and 24mo HSC.
(D) Average number of CpGs in DNA methylation Canyon regions differentially methylated between 4mo and 24mo HSC. Canyons are defined in 12mo HSC. DMCs counts are normalized by region length. Canyon Core, region inset by 500 bp on each edge; Inner and Outer Edge, 500 bp regions inside and outside Canyon edges, respectively; Error bars, SEM.
(E) H3K27me3 (left) and H3K4me3 (right) peak coverage density of Canyons relative to aging DMCs. Density of peaks in 4mo HSC at Canyons subset by normalized counts of aging DMCs. H3K4me3 consists of H3K4me3 peaks alone. H3K27me3 consists of any peak region containing H3K27me3, including bivalent (co-occupancy by H3K4me3) and H3K27me3 alone. More Hypo and Hyper indicate Canyons with greater numbers of hypomethylated or hypermethylated DMCs, respectively.
See also Figures S6 and S7.

