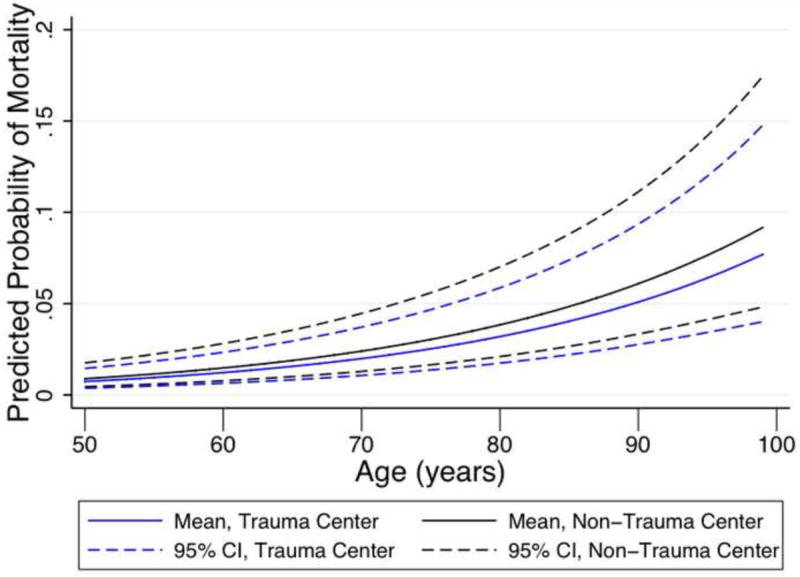
Figure 3. Predicted probability of mortality in patients treated at TCs compared to those treated at NTCs.

The predicted probabilities of mortality are presented relative to the 50 year aged population. Dashed lines represent the 95 percent confidence intervals for the estimated predicted probabilities. TC=trauma center; NTC=non-trauma center.
