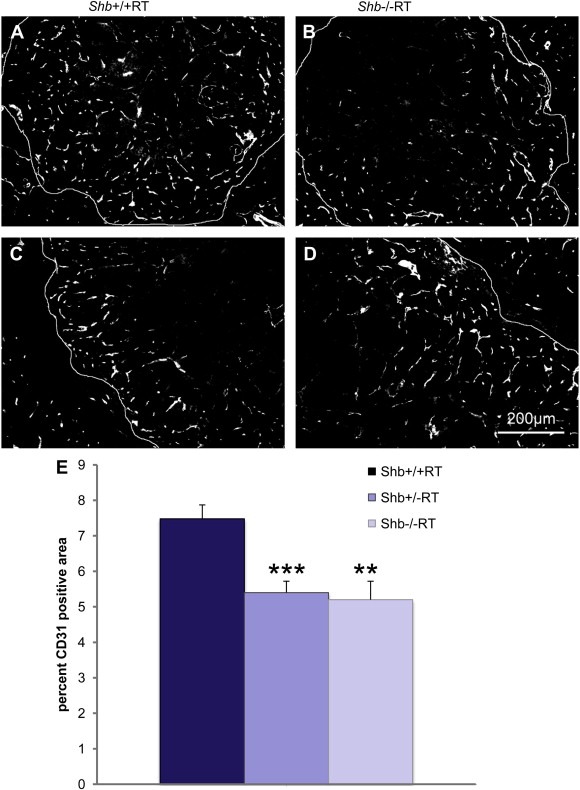
Figure 2.

(A–D) CD31 staining of Shb+/+ (A, C) or Shb−/− (B, D) RIP‐Tag2 tumors and tumor vascular density (E). Small (A, B) and large (C, D) tumors are shown at 12 weeks of age. Large tumors, were defined as having a Feret's diameter >2.0 mm or a V > 2.0mm3, and small tumors, were defined as having a Feret's diameter approx. 1–1.5 mm. Original magnification 100×. * indicates p < 0.05 with a Student's t‐test.
