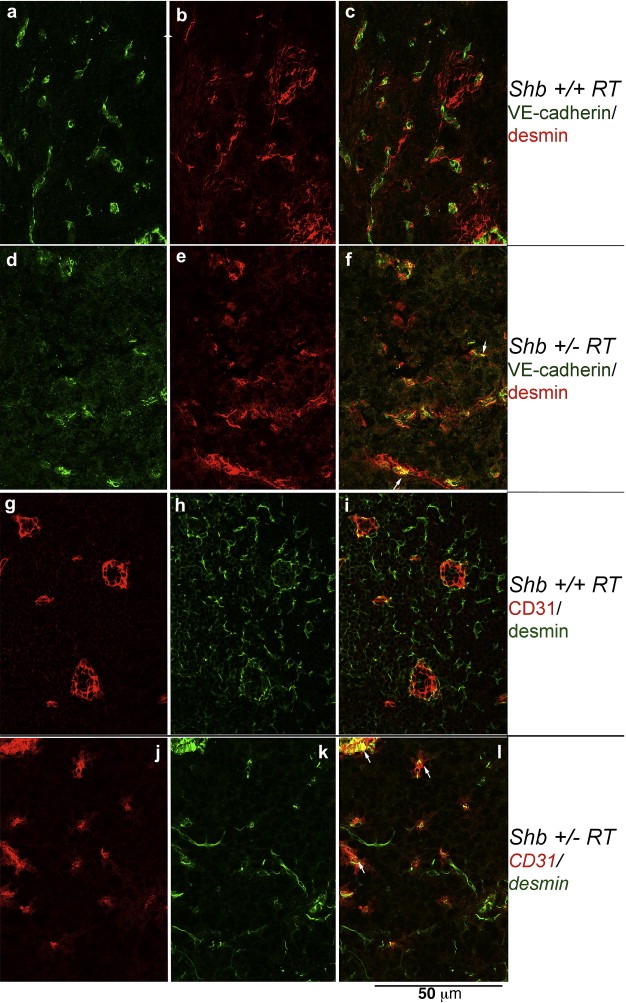
Figure 3.

Staining of Shb+/+RT (a–c, g–i) and Shb+/−RT (d–f, j–l) tumors for pericyte (desmin, b‐c, e‐f, h‐i, k‐l) and vascular (CD31 in g, i, j, l and VE‐cadherin in a, c, d, f) markers. Confocal images (0.1 μm slice thickness) are shown. Arrows indicate structures with co‐localization of the vascular and pericyte markers. Original magnification 600×.
