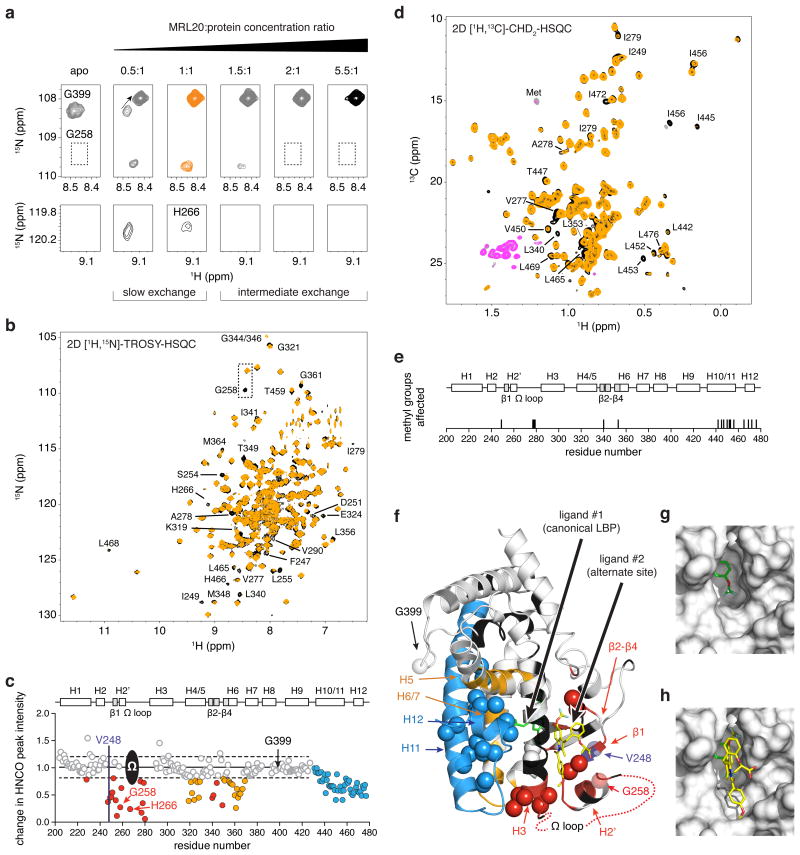
Figure 2. Mapping the alternate MRL20 binding site in PPARγ.
(a) Titration of MRL20 into 15N-PPARγ LBD monitored by 2D [1H,15N]-TROSY-HSQC NMR reveals two binding transitions. The first slow exchange transition corresponds to the canonical LBP binding event (apo to 1:1), and the second intermediate exchange transition to the alternate site binding event (>1:1 stoichiometry). (b) Comparison of 2D [1H,15N]-TROSY-HSQC spectra for 15N-PPARγ LBD bound to 1 or 2 molecules of MRL20 (black and orange, respectively). (c) NMR chemical shift footprinting reveals a decrease in peak intensity between 3D TROSY-HNCO experiments collected for 2H,13C,15N-PPARγ LBD bound to 1 or 2 molecules of MRL20 (black/pink and orange/grey, respectively, for positive/negative peak amplitudes) and reveals residues affected by the alternate site binding event. (d) Comparison of 2D [1H,13C]-methyl CHD2-detected HSQC data for 2H,13C,15N-PPARγ LBD bound to 1 or 2 molecules of MRL20. (e) Residues with methyl NMR resonances affected upon binding a second MRL20 ligand. (f) NMR chemical shift footprinting changes mapped onto the PPARγ LBD structure reveals the site of interaction (red) and regions allosterically affected by alternate site binding (blue,orange); spheres represent methyl groups affected, and regions colored black have unassigned NMR chemical shifts likely due to dynamics on the NMR intermediate exchange regime. (g) The alternate site is formed by a solvent-accessible pocket on the PPARγ LBD surface. (h) Molecular docking of a second MRL20 ligand (yellow) into the alternate site, which is also shown in (f).

