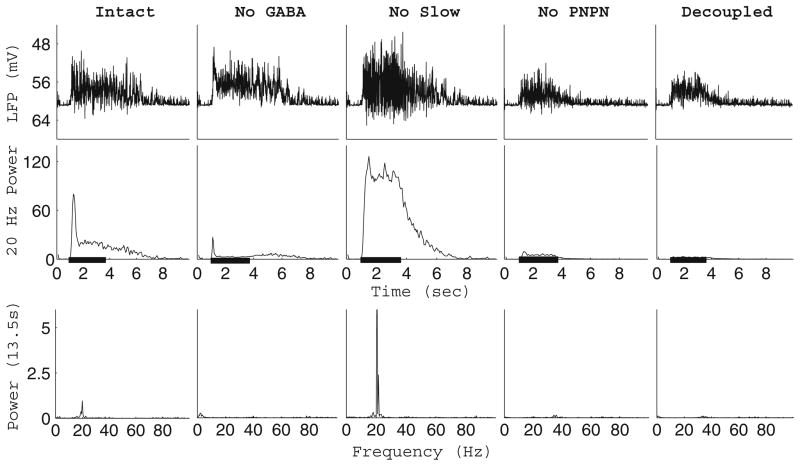
Fig. 2.
Emergence of 20 Hz LFP oscillations. Oscillations in the LFP of the intact network, network with GABA removed, network with no slow inhibition, network with no PN-PN connections, and the completely decoupled network during stimulus presentation (stimulus duration indicated by the black bar). An LFP trace of the network is presented (top row), along with integrated power in the 15–25 Hz range (middle row, 200 ms sliding window, 50 ms step size, 20 trial average), and the power spectrum of the LFP during stimulus presentation (bottom row, single trial)

