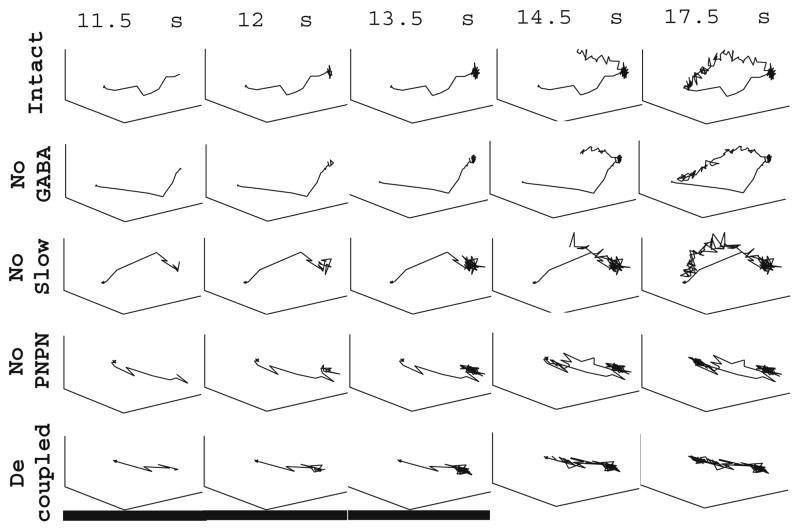
Fig. 4.
Principal component trajectories. Principal component trajectories computed from PN firing rates (averaged over 20 trials) in response to a single simulated odor (stimulus duration indicated by the black bar). Trajectories were computed for the intact network (top row), the network with GABA input to the PNs removed (second row), the network with no slow inhibition (third row), the network with no PN-PN connections (fourth row), and the completely decoupled network with no cell-cell connections (bottom row)

